| Red | Green | Blue | |
| z | 17.64 | ||
| znorm | Inf | ||
| sky | -NaN | -Inf | -NaN |
| S/N | 16.1 | 30.1 | 32.0 |
| S/N(c) | 0.0 | 0.0 | 0.0 |
| SN(E/C) |
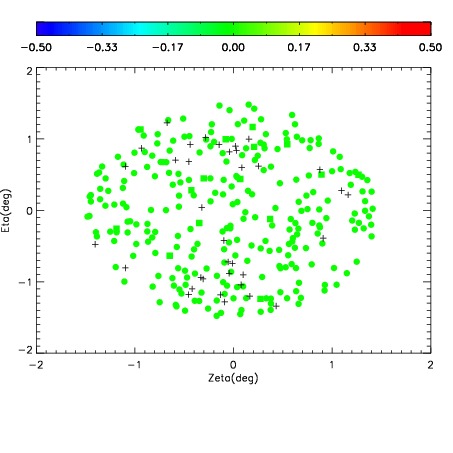
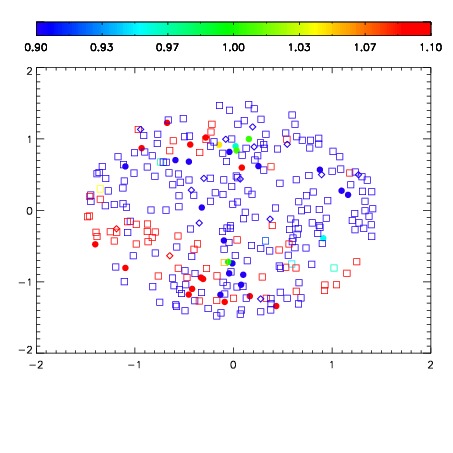
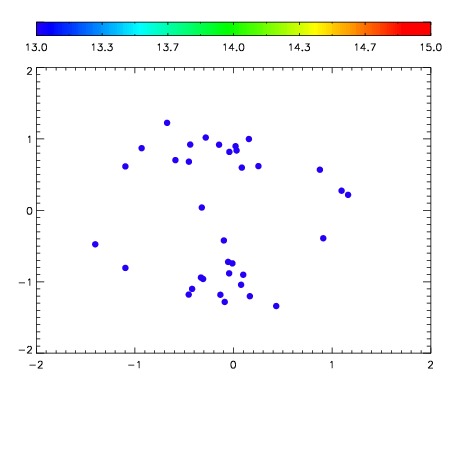

| Frame | Nreads | Zeropoints | Mag plots | Spatial mag deviation | Spatial sky 16325A emission deviations (filled: sky, open: star) | Spatial sky continuum emission | Spatial sky telluric CO2 absorption deviations (filled: H < 10) | |||||||||||||||||||||||
| 0 | 0 |
|
|
|
|
|
|
| IPAIR | NAME | SHIFT | NEWSHIFT | S/N | NAME | SHIFT | NEWSHIFT | S/N |
| 0 | 18100031 | 0.00565905 | 0.00000 | 17.5092 | 18100032 | -0.495626 | 0.501285 | 17.4539 |
| 1 | 18100027 | 0.00000 | 0.00565905 | 18.3920 | 18100028 | -0.499475 | 0.505134 | 18.3658 |
| 2 | 18100030 | 0.00536375 | 0.000295300 | 18.3549 | 18100029 | -0.499025 | 0.504684 | 18.2669 |