| Red | Green | Blue | |
| z | 17.64 | ||
| znorm | Inf | ||
| sky | -Inf | -Inf | -NaN |
| S/N | 23.4 | 43.8 | 47.2 |
| S/N(c) | 0.0 | 0.0 | 0.0 |
| SN(E/C) |
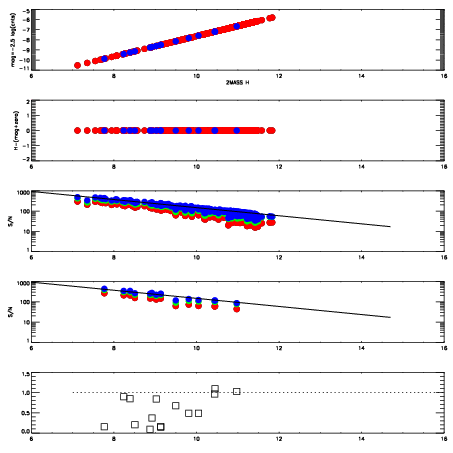
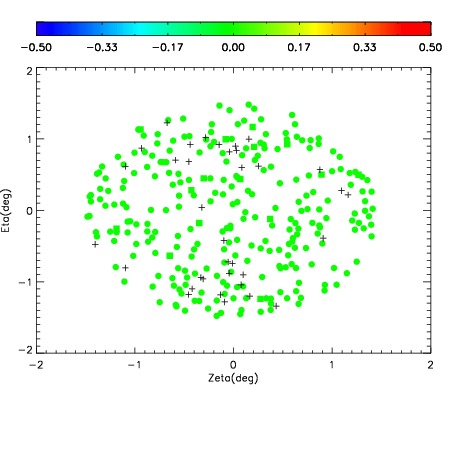
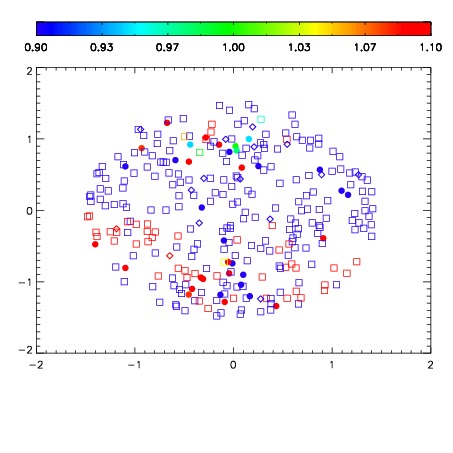
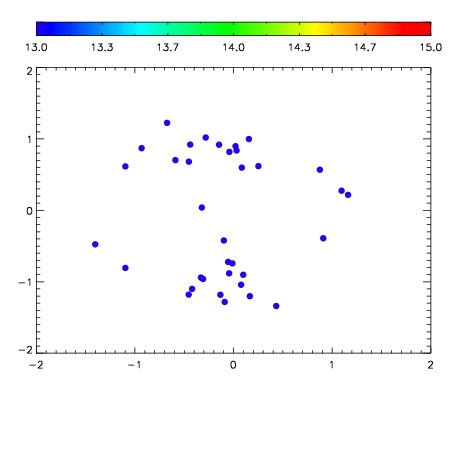

| Frame | Nreads | Zeropoints | Mag plots | Spatial mag deviation | Spatial sky 16325A emission deviations (filled: sky, open: star) | Spatial sky continuum emission | Spatial sky telluric CO2 absorption deviations (filled: H < 10) | |||||||||||||||||||||||
| 0 | 0 |
|
|
|
|
|
|
| IPAIR | NAME | SHIFT | NEWSHIFT | S/N | NAME | SHIFT | NEWSHIFT | S/N |
| 0 | 18110049 | 0.00462837 | 0.00000 | 18.1057 | 18110050 | -0.501419 | 0.506047 | 18.0732 |
| 1 | 18110037 | 0.00000 | 0.00462837 | 18.3054 | 18110038 | -0.503570 | 0.508198 | 18.2576 |
| 2 | 18110044 | 0.00120409 | 0.00342428 | 18.2752 | 18110039 | -0.504761 | 0.509389 | 18.2342 |
| 3 | 18110040 | 0.000719596 | 0.00390877 | 18.2623 | 18110046 | -0.502383 | 0.507011 | 18.2046 |
| 4 | 18110045 | 0.00215543 | 0.00247294 | 18.2537 | 18110043 | -0.505392 | 0.510020 | 18.1590 |
| 5 | 18110041 | -7.84232e-06 | 0.00463621 | 18.0606 | 18110042 | -0.506529 | 0.511157 | 17.9804 |
| 6 | 18110048 | 0.00404722 | 0.000581150 | 17.6953 | 18110047 | -0.502587 | 0.507215 | 17.7244 |