| Red | Green | Blue | |
| z | 17.63 | ||
| znorm | Inf | ||
| sky | -NaN | -NaN | -Inf |
| S/N | 34.4 | 53.9 | 64.9 |
| S/N(c) | 0.0 | 0.0 | 0.0 |
| SN(E/C) |

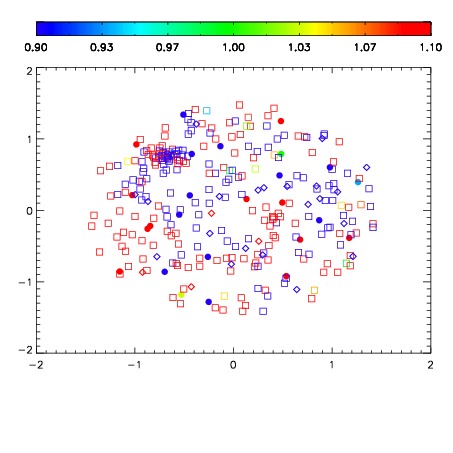
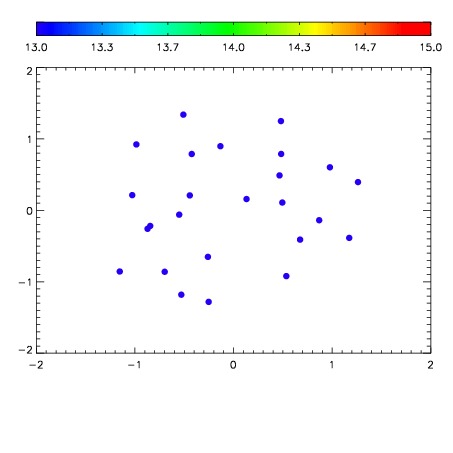

| Frame | Nreads | Zeropoints | Mag plots | Spatial mag deviation | Spatial sky 16325A emission deviations (filled: sky, open: star) | Spatial sky continuum emission | Spatial sky telluric CO2 absorption deviations (filled: H < 10) | |||||||||||||||||||||||
| 0 | 0 |
|
|
|
|
|
|
| 01970009 | 0.00000 | 18.9898 |
| 01970010 | 0.00000 | 18.9953 |
| 01970011 | 0.00000 | 18.9819 |
| 01970012 | 0.00000 | 18.5739 |
| 01970013 | 0.00000 | 18.4755 |
| 01970014 | 0.00000 | 18.7197 |
| 01970015 | 0.00000 | 18.8773 |
| 01970016 | 0.00000 | 18.9022 |
| 01970017 | 0.00000 | 18.8714 |