| Red | Green | Blue | |
| z | 17.64 | ||
| znorm | Inf | ||
| sky | -Inf | -NaN | -Inf |
| S/N | 59.5 | 90.1 | 105.7 |
| S/N(c) | 59.1 | 110.7 | 83.7 |
| SN(E/C) |
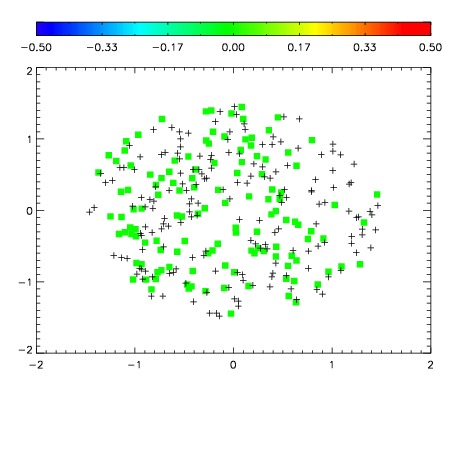
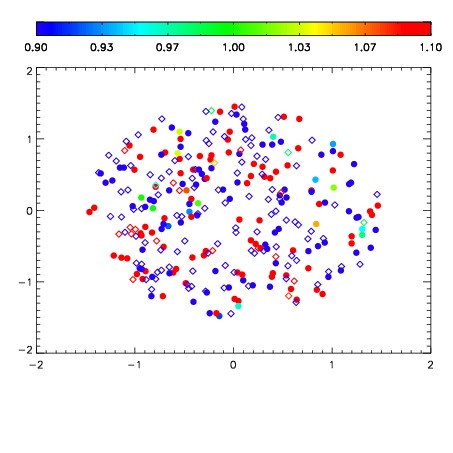
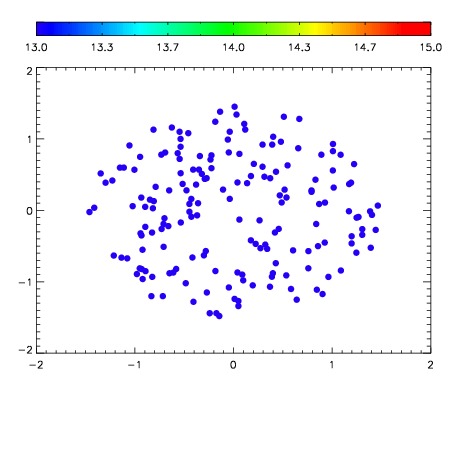

| Frame | Nreads | Zeropoints | Mag plots | Spatial mag deviation | Spatial sky 16325A emission deviations (filled: sky, open: star) | Spatial sky continuum emission | Spatial sky telluric CO2 absorption deviations (filled: H < 10) | |||||||||||||||||||||||
| 0 | 0 |
|
|
|
|
|
|
| 01620034 | 0.00000 | 18.9537 |
| 01620035 | 0.00000 | 19.0192 |
| 01620036 | 0.00000 | 19.0441 |
| 01620037 | 0.00000 | 19.0241 |
| 01620038 | 0.00000 | 19.1065 |
| 01620039 | 0.00000 | 19.1159 |
| 01620040 | 0.00000 | 19.1173 |
| 01620041 | 0.00000 | 19.1358 |
| 01620042 | 0.00000 | 19.1731 |
| 01620043 | 0.00000 | 19.1829 |
| 01620044 | 0.00000 | 19.1991 |
| 01620045 | 0.00000 | 19.2016 |