| Red | Green | Blue | |
| z | 17.63 | ||
| znorm | Inf | ||
| sky | -NaN | -NaN | -Inf |
| S/N | 33.9 | 56.5 | 67.9 |
| S/N(c) | 0.0 | 0.0 | 0.0 |
| SN(E/C) |

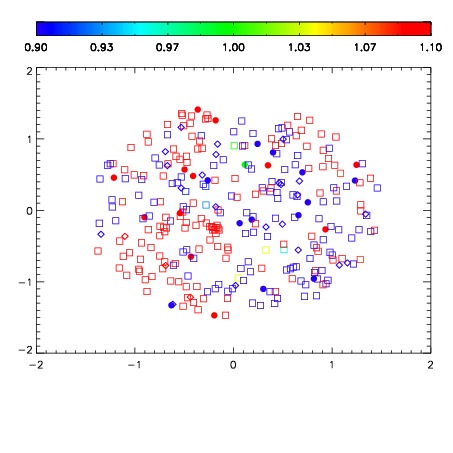
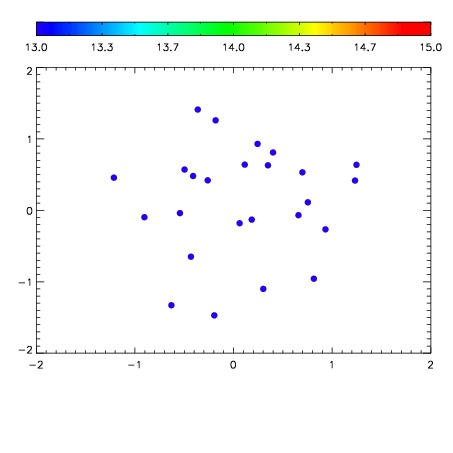

| Frame | Nreads | Zeropoints | Mag plots | Spatial mag deviation | Spatial sky 16325A emission deviations (filled: sky, open: star) | Spatial sky continuum emission | Spatial sky telluric CO2 absorption deviations (filled: H < 10) | |||||||||||||||||||||||
| 0 | 0 |
|
|
|
|
|
|
| 01650022 | 0.00000 | 19.1040 |
| 01650023 | 0.00000 | 19.1116 |
| 01650024 | 0.00000 | 19.1578 |
| 01650025 | 0.00000 | 19.1661 |
| 01650026 | 0.00000 | 19.1441 |
| 01650027 | 0.00000 | 19.1640 |