| Red | Green | Blue | |
| z | 17.64 | ||
| znorm | Inf | ||
| sky | -Inf | -Inf | -Inf |
| S/N | 35.7 | 57.6 | 67.2 |
| S/N(c) | 0.0 | 0.0 | 0.0 |
| SN(E/C) |
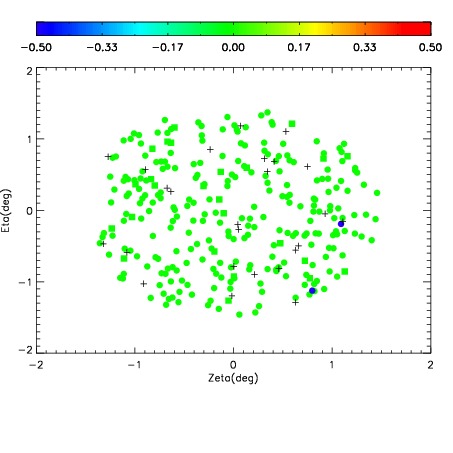
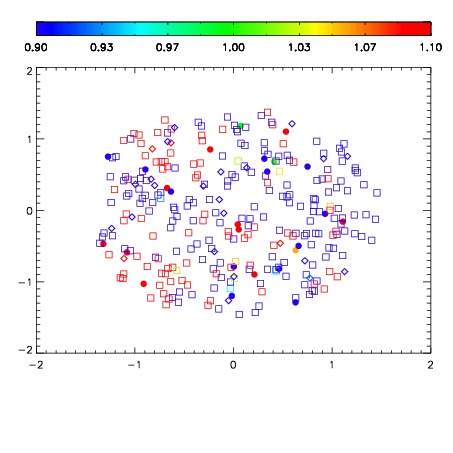
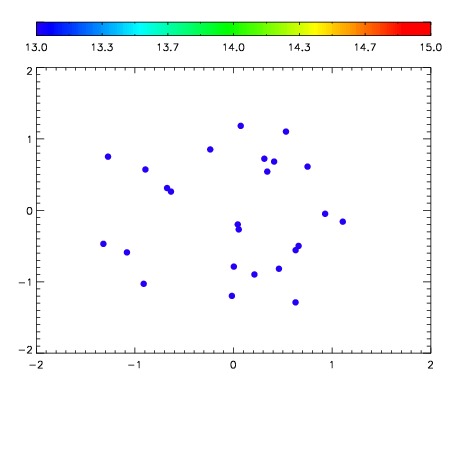

| Frame | Nreads | Zeropoints | Mag plots | Spatial mag deviation | Spatial sky 16325A emission deviations (filled: sky, open: star) | Spatial sky continuum emission | Spatial sky telluric CO2 absorption deviations (filled: H < 10) | |||||||||||||||||||||||
| 0 | 0 |
|
|
|
|
|
|
| 01610034 | 0.00000 | 19.0557 |
| 01610035 | 0.00000 | 19.1390 |
| 01610036 | 0.00000 | 19.1419 |
| 01610037 | 0.00000 | 19.1589 |
| 01610038 | 0.00000 | 19.1546 |
| 01610039 | 0.00000 | 19.1140 |