| Red | Green | Blue | |
| z | 17.64 | ||
| znorm | Inf | ||
| sky | -Inf | -NaN | -Inf |
| S/N | 29.3 | 51.3 | 55.2 |
| S/N(c) | 0.0 | 0.0 | 0.0 |
| SN(E/C) |
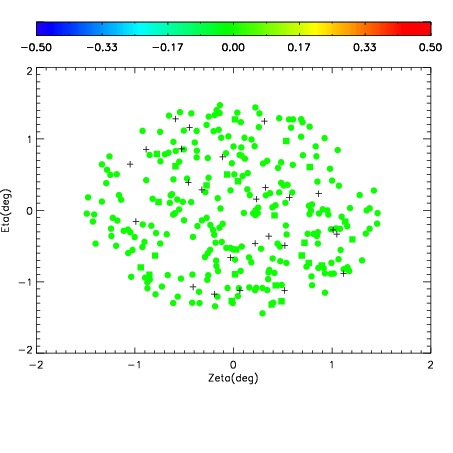
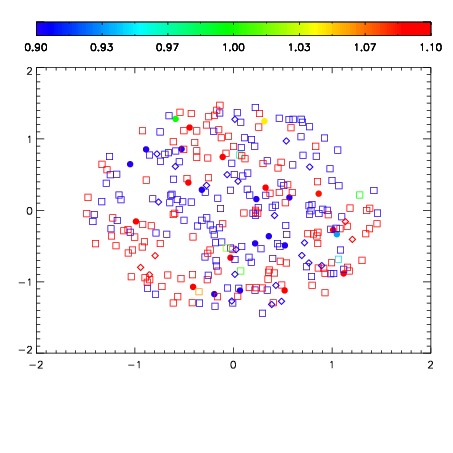
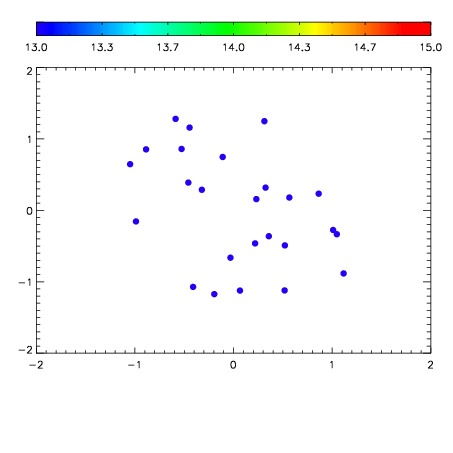

| Frame | Nreads | Zeropoints | Mag plots | Spatial mag deviation | Spatial sky 16325A emission deviations (filled: sky, open: star) | Spatial sky continuum emission | Spatial sky telluric CO2 absorption deviations (filled: H < 10) | |||||||||||||||||||||||
| 0 | 0 |
|
|
|
|
|
|
| 01970022 | 0.00000 | 18.9050 |
| 01970023 | 0.00000 | 18.7986 |
| 01970024 | 0.00000 | 18.8624 |
| 01970025 | 0.00000 | 18.9395 |
| 01970026 | 0.00000 | 18.7223 |
| 01970027 | 0.00000 | 18.7559 |
| 01970028 | 0.00000 | 18.5014 |