| Red | Green | Blue | |
| z | 17.63 | ||
| znorm | Inf | ||
| sky | -NaN | -NaN | -Inf |
| S/N | 45.2 | 76.0 | 87.7 |
| S/N(c) | 0.0 | 0.0 | 0.0 |
| SN(E/C) |
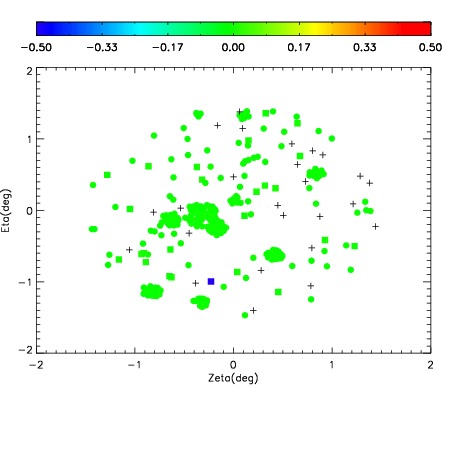
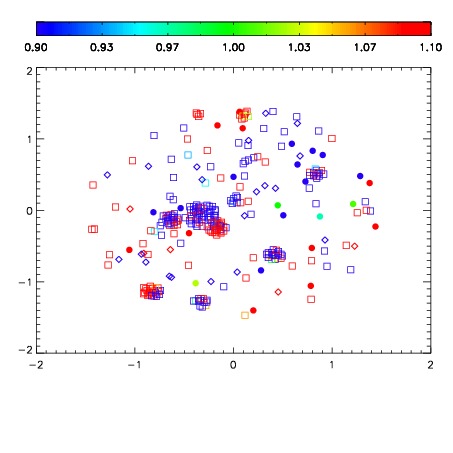
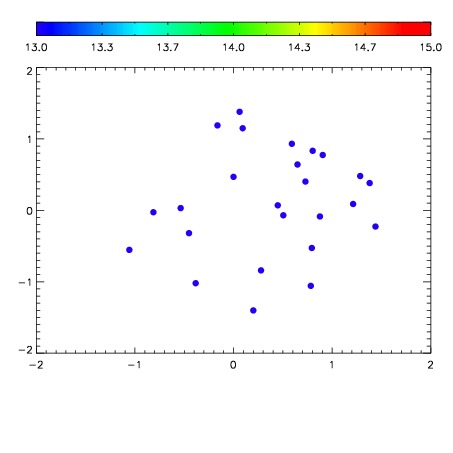

| Frame | Nreads | Zeropoints | Mag plots | Spatial mag deviation | Spatial sky 16325A emission deviations (filled: sky, open: star) | Spatial sky continuum emission | Spatial sky telluric CO2 absorption deviations (filled: H < 10) | |||||||||||||||||||||||
| 0 | 0 |
|
|
|
|
|
|
| 01410027 | 0.00000 | 18.7113 |
| 01410028 | 0.00000 | 18.7518 |
| 01410029 | 0.00000 | 18.9054 |
| 01410030 | 0.00000 | 18.9923 |
| 01410031 | 0.00000 | 18.9811 |
| 01410032 | 0.00000 | 19.0320 |
| 01410033 | 0.00000 | 18.9824 |
| 01410034 | 0.00000 | 19.0612 |
| 01410035 | 0.00000 | 19.1361 |
| 01410036 | 0.00000 | 19.1566 |
| 01410037 | 0.00000 | 19.1573 |
| 01410038 | 0.00000 | 19.1453 |
| 01410039 | 0.00000 | 19.1263 |
| 01410040 | 0.00000 | 19.0750 |