| Red | Green | Blue | |
| z | 17.64 | ||
| znorm | Inf | ||
| sky | -NaN | -NaN | -Inf |
| S/N | 29.8 | 50.2 | 56.7 |
| S/N(c) | 0.0 | 0.0 | 0.0 |
| SN(E/C) |
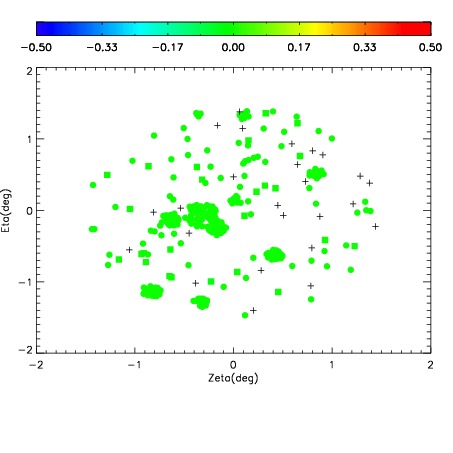
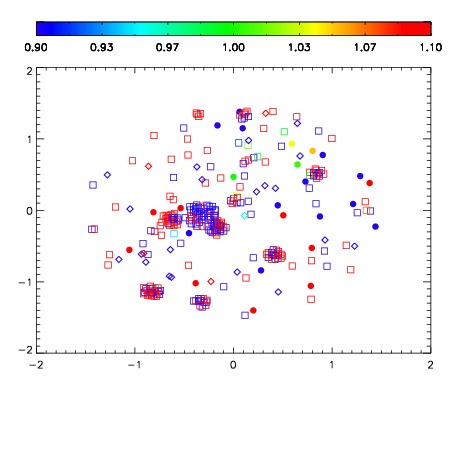
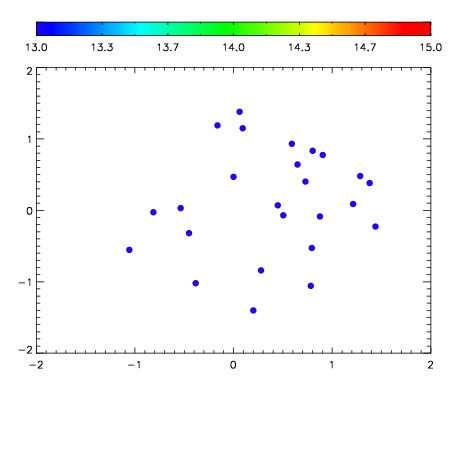

| Frame | Nreads | Zeropoints | Mag plots | Spatial mag deviation | Spatial sky 16325A emission deviations (filled: sky, open: star) | Spatial sky continuum emission | Spatial sky telluric CO2 absorption deviations (filled: H < 10) | |||||||||||||||||||||||
| 0 | 0 |
|
|
|
|
|
|
| 01720055 | 0.00000 | 18.2110 |
| 01720056 | 0.00000 | 18.5226 |
| 01720057 | 0.00000 | 18.8275 |
| 01720058 | 0.00000 | 18.7887 |
| 01720059 | 0.00000 | 18.8954 |
| 01720060 | 0.00000 | 18.9396 |
| 01720061 | 0.00000 | 19.0486 |
| 01720062 | 0.00000 | 18.8172 |