| Red | Green | Blue | |
| z | 17.64 | ||
| znorm | Inf | ||
| sky | -NaN | -Inf | -Inf |
| S/N | 57.4 | 79.6 | 79.3 |
| S/N(c) | 0.0 | 0.0 | 0.0 |
| SN(E/C) |

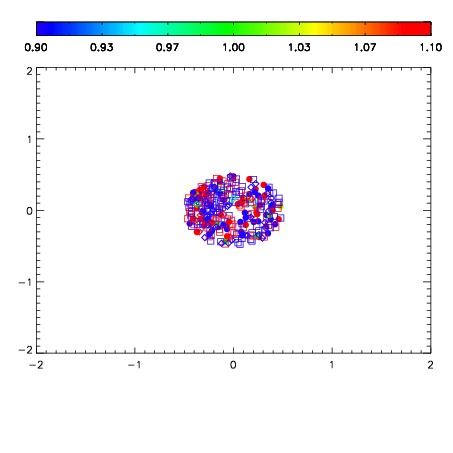
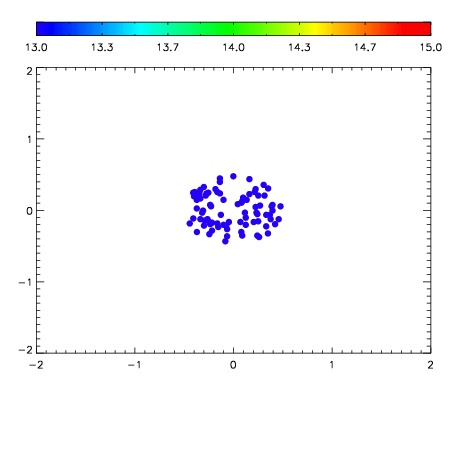

| Frame | Nreads | Zeropoints | Mag plots | Spatial mag deviation | Spatial sky 16325A emission deviations (filled: sky, open: star) | Spatial sky continuum emission | Spatial sky telluric CO2 absorption deviations (filled: H < 10) | |||||||||||||||||||||||
| 0 | 0 |
|
|
|
|
|
|
| 01650044 | 0.00000 | 18.7320 |
| 01650045 | 0.00000 | 18.8491 |
| 01650046 | 0.00000 | 18.9565 |
| 01650047 | 0.00000 | 18.9517 |
| 01650048 | 0.00000 | 18.8883 |
| 01650049 | 0.00000 | 18.9100 |
| 01650050 | 0.00000 | 18.9633 |
| 01650051 | 0.00000 | 18.9436 |
| 01650052 | 0.00000 | 18.8994 |
| 01650053 | 0.00000 | 18.9078 |
| 01650054 | 0.00000 | 18.8093 |
| 01650055 | 0.00000 | 18.8978 |
| 01650056 | 0.00000 | 18.9489 |