| Red | Green | Blue | |
| z | 17.64 | ||
| znorm | Inf | ||
| sky | -NaN | -NaN | -Inf |
| S/N | 34.5 | 48.8 | 48.9 |
| S/N(c) | 0.0 | 0.0 | 0.0 |
| SN(E/C) |
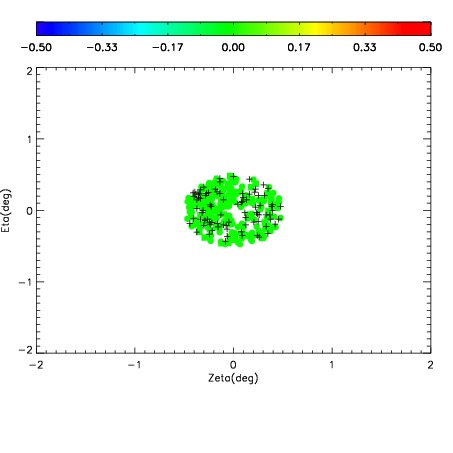
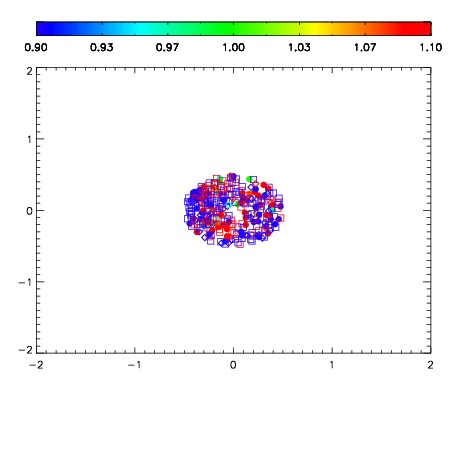
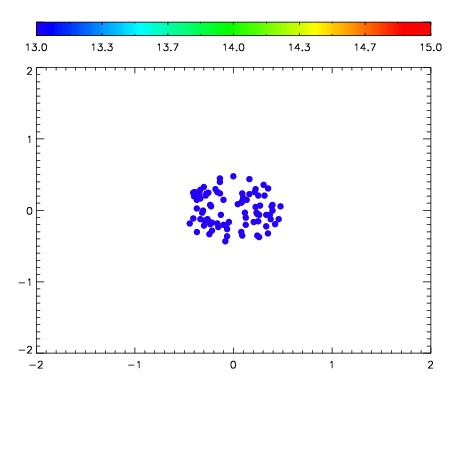

| Frame | Nreads | Zeropoints | Mag plots | Spatial mag deviation | Spatial sky 16325A emission deviations (filled: sky, open: star) | Spatial sky continuum emission | Spatial sky telluric CO2 absorption deviations (filled: H < 10) | |||||||||||||||||||||||
| 0 | 0 |
|
|
|
|
|
|
| IPAIR | NAME | SHIFT | NEWSHIFT | S/N | NAME | SHIFT | NEWSHIFT | S/N |
| 0 | 12750016 | 0.488342 | 0.00000 | 19.0396 | 12750013 | 0.000161064 | 0.488181 | 19.0207 |
| 1 | 12750015 | 0.487594 | 0.000747979 | 19.0199 | 12750014 | 0.000255551 | 0.488086 | 19.0096 |
| 2 | 12750012 | 0.486511 | 0.00183100 | 18.9891 | 12750017 | 0.000748349 | 0.487594 | 19.0067 |
| 3 | 12750011 | 0.485646 | 0.00269598 | 18.9668 | 12750010 | 0.00000 | 0.488342 | 18.9023 |