| Red | Green | Blue | |
| z | 17.64 | ||
| znorm | Inf | ||
| sky | -Inf | -NaN | -NaN |
| S/N | 29.6 | 42.0 | 41.3 |
| S/N(c) | 0.0 | 0.0 | 0.0 |
| SN(E/C) |
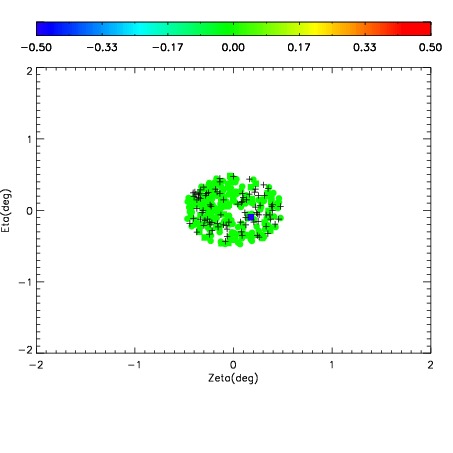
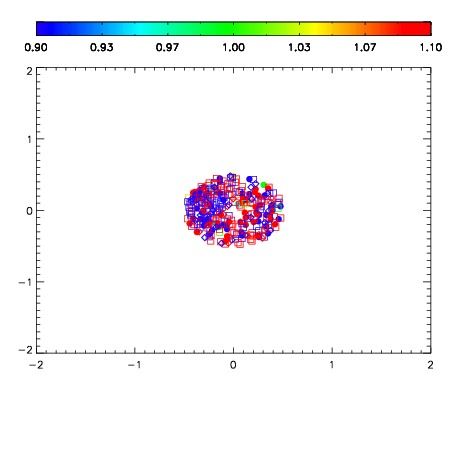
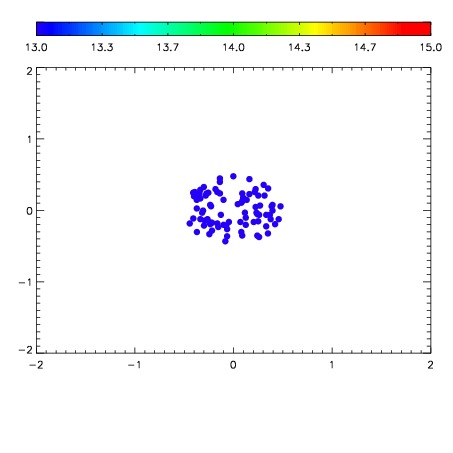

| Frame | Nreads | Zeropoints | Mag plots | Spatial mag deviation | Spatial sky 16325A emission deviations (filled: sky, open: star) | Spatial sky continuum emission | Spatial sky telluric CO2 absorption deviations (filled: H < 10) | |||||||||||||||||||||||
| 0 | 0 |
|
|
|
|
|
|
| IPAIR | NAME | SHIFT | NEWSHIFT | S/N | NAME | SHIFT | NEWSHIFT | S/N |
| 0 | 12880018 | 0.476186 | 0.00000 | 18.8812 | 12880020 | 0.000278056 | 0.475908 | 18.9176 |
| 1 | 12880021 | 0.473991 | 0.00219500 | 18.9401 | 12880019 | -3.41618e-05 | 0.476220 | 18.9734 |
| 2 | 12880022 | 0.473779 | 0.00240701 | 18.8047 | 12880023 | -0.00287169 | 0.479058 | 18.6714 |
| 3 | 12880017 | 0.476091 | 9.50098e-05 | 18.7344 | 12880016 | 0.00000 | 0.476186 | 18.5811 |