| Red | Green | Blue | |
| z | 17.64 | ||
| znorm | Inf | ||
| sky | -NaN | -NaN | -Inf |
| S/N | 61.7 | 84.7 | 90.8 |
| S/N(c) | 0.0 | 0.0 | 0.0 |
| SN(E/C) |
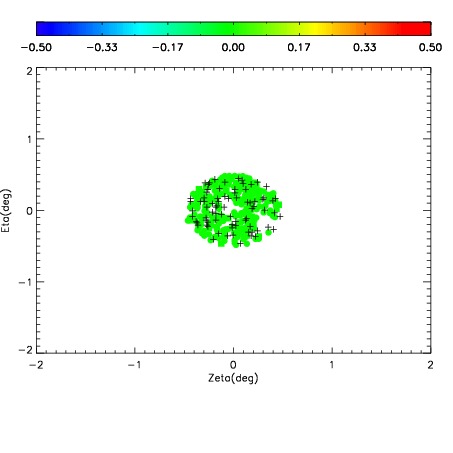

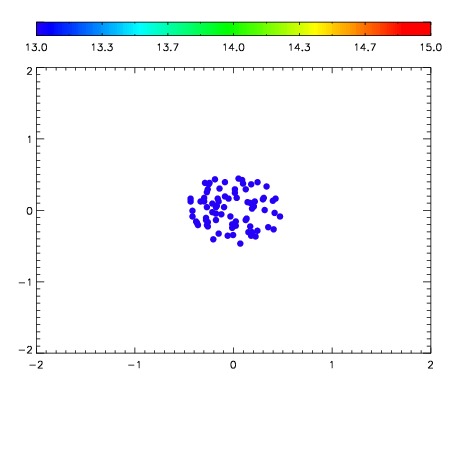

| Frame | Nreads | Zeropoints | Mag plots | Spatial mag deviation | Spatial sky 16325A emission deviations (filled: sky, open: star) | Spatial sky continuum emission | Spatial sky telluric CO2 absorption deviations (filled: H < 10) | |||||||||||||||||||||||
| 0 | 0 |
|
|
|
|
|
|
| 01620052 | 0.00000 | 19.0375 |
| 01620053 | 0.00000 | 19.0993 |
| 01620054 | 0.00000 | 19.1133 |
| 01620055 | 0.00000 | 19.1146 |
| 01620056 | 0.00000 | 19.1341 |
| 01620057 | 0.00000 | 19.1630 |
| 01620058 | 0.00000 | 19.1352 |
| 01620059 | 0.00000 | 19.1993 |
| 01620060 | 0.00000 | 19.2014 |
| 01620061 | 0.00000 | 19.2126 |
| 01620062 | 0.00000 | 19.2038 |