| Red | Green | Blue | |
| z | 17.64 | ||
| znorm | Inf | ||
| sky | -Inf | -Inf | -Inf |
| S/N | 65.4 | 95.9 | 110.0 |
| S/N(c) | 0.0 | 0.0 | 0.0 |
| SN(E/C) |
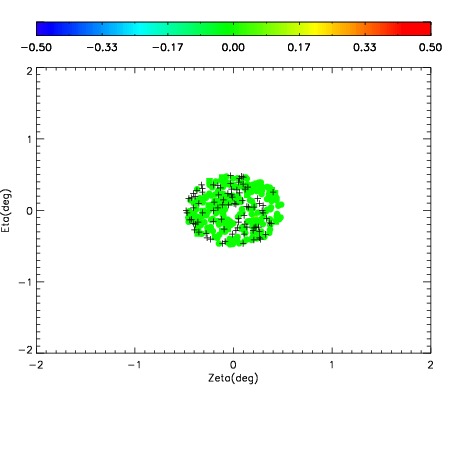
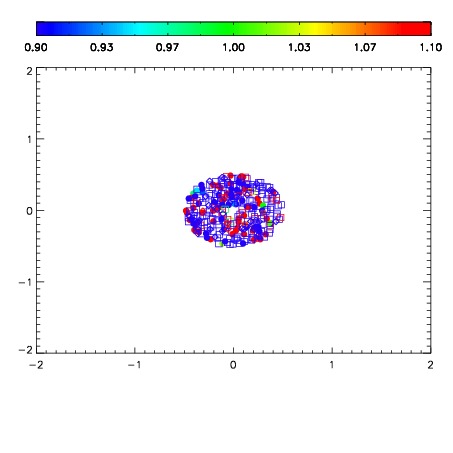
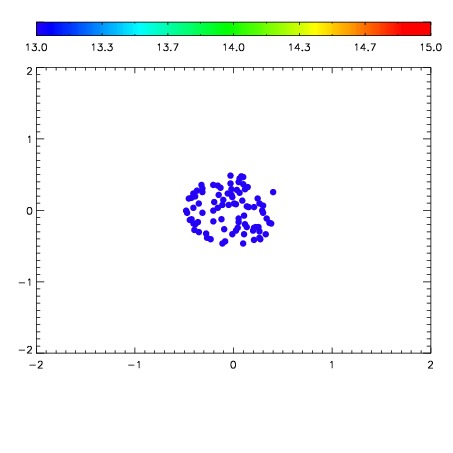

| Frame | Nreads | Zeropoints | Mag plots | Spatial mag deviation | Spatial sky 16325A emission deviations (filled: sky, open: star) | Spatial sky continuum emission | Spatial sky telluric CO2 absorption deviations (filled: H < 10) | |||||||||||||||||||||||
| 0 | 0 |
|
|
|
|
|
|
| 01610048 | 0.00000 | 19.1170 |
| 01610049 | 0.00000 | 19.1806 |
| 01610050 | 0.00000 | 19.1659 |
| 01610051 | 0.00000 | 19.1560 |
| 01610052 | 0.00000 | 19.1399 |
| 01610053 | 0.00000 | 19.1227 |
| 01610054 | 0.00000 | 19.1377 |
| 01610055 | 0.00000 | 18.9049 |
| 01610056 | 0.00000 | 19.1678 |
| 01610057 | 0.00000 | 19.1669 |
| 01610058 | 0.00000 | 19.1771 |
| 01610059 | 0.00000 | 19.2149 |
| 01610060 | 0.00000 | 19.2221 |