| Red | Green | Blue | |
| z | 17.64 | ||
| znorm | Inf | ||
| sky | -NaN | -Inf | -Inf |
| S/N | 48.1 | 59.9 | 56.4 |
| S/N(c) | 0.0 | 0.0 | 0.0 |
| SN(E/C) |
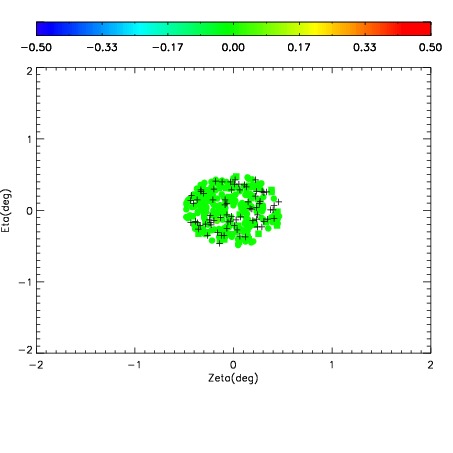
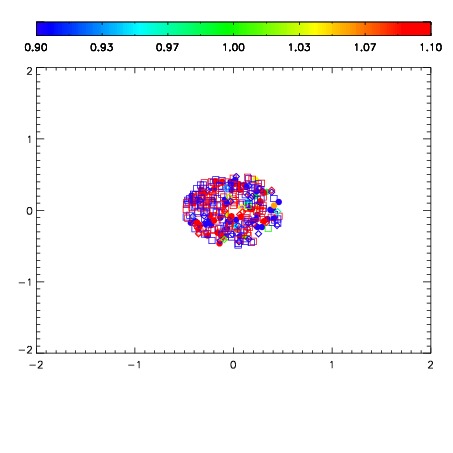


| Frame | Nreads | Zeropoints | Mag plots | Spatial mag deviation | Spatial sky 16325A emission deviations (filled: sky, open: star) | Spatial sky continuum emission | Spatial sky telluric CO2 absorption deviations (filled: H < 10) | |||||||||||||||||||||||
| 0 | 0 |
|
|
|
|
|
|
| 01420036 | 0.00000 | 18.5915 |
| 01420037 | 0.00000 | 18.8060 |
| 01420038 | 0.00000 | 18.8618 |
| 01420039 | 0.00000 | 18.9660 |
| 01420040 | 0.00000 | 19.0058 |
| 01420041 | 0.00000 | 19.0273 |
| 01420042 | 0.00000 | 19.0381 |
| 01420043 | 0.00000 | 19.0784 |
| 01420044 | 0.00000 | 18.9689 |
| 01420045 | 0.00000 | 19.0202 |