| Red | Green | Blue | |
| z | 17.64 | ||
| znorm | Inf | ||
| sky | -Inf | -Inf | -Inf |
| S/N | 29.1 | 49.6 | 61.5 |
| S/N(c) | 0.0 | 0.0 | 0.0 |
| SN(E/C) |
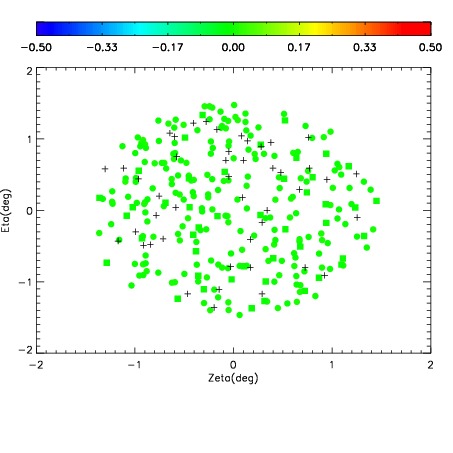
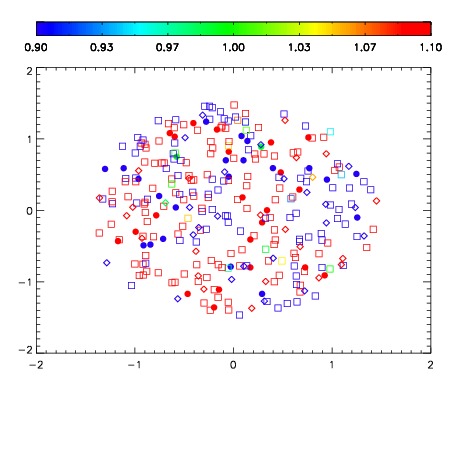
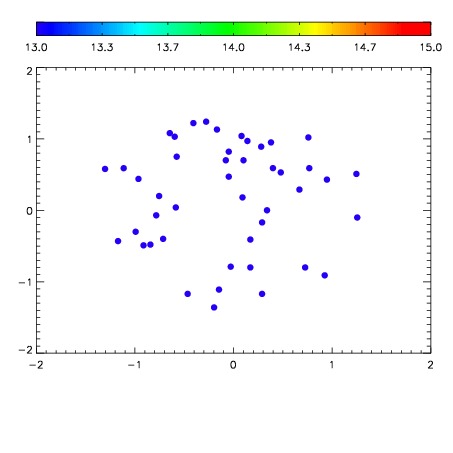

| Frame | Nreads | Zeropoints | Mag plots | Spatial mag deviation | Spatial sky 16325A emission deviations (filled: sky, open: star) | Spatial sky continuum emission | Spatial sky telluric CO2 absorption deviations (filled: H < 10) | |||||||||||||||||||||||
| 0 | 0 |
|
|
|
|
|
|
| 01730019 | 0.00000 | 18.7511 |
| 01730020 | 0.00000 | 18.7460 |
| 01730021 | 0.00000 | 18.7148 |
| 01730022 | 0.00000 | 18.6973 |
| 01730023 | 0.00000 | 18.6484 |
| 01730024 | 0.00000 | 18.6647 |
| 01730025 | 0.00000 | 18.6118 |
| 01730026 | 0.00000 | 18.6576 |