| Red | Green | Blue | |
| z | 17.63 | ||
| znorm | Inf | ||
| sky | -NaN | -NaN | -Inf |
| S/N | 35.0 | 61.1 | 67.4 |
| S/N(c) | 0.0 | 0.0 | 0.0 |
| SN(E/C) |
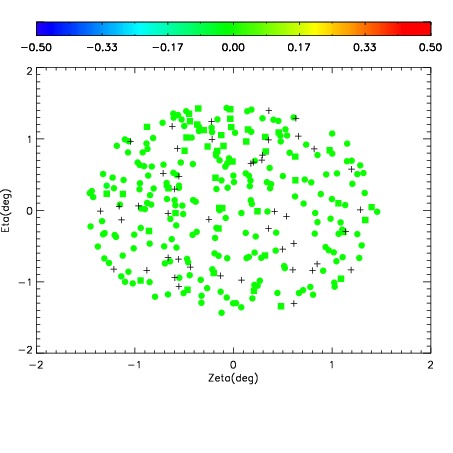
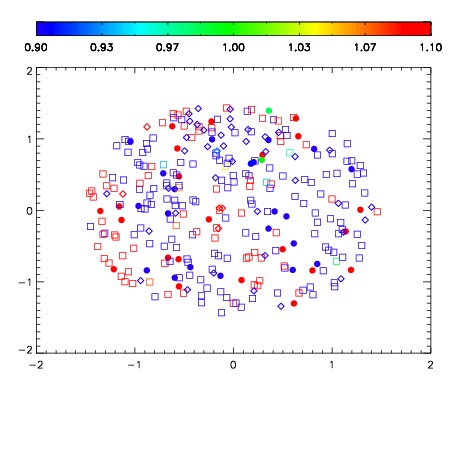
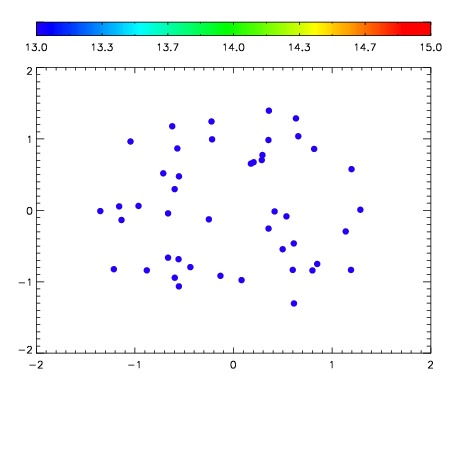

| Frame | Nreads | Zeropoints | Mag plots | Spatial mag deviation | Spatial sky 16325A emission deviations (filled: sky, open: star) | Spatial sky continuum emission | Spatial sky telluric CO2 absorption deviations (filled: H < 10) | |||||||||||||||||||||||
| 0 | 0 |
|
|
|
|
|
|
| 01650076 | 0.00000 | 18.1771 |
| 01650077 | 0.00000 | 18.1361 |
| 01650078 | 0.00000 | 17.4746 |
| 01650079 | 0.00000 | 16.4544 |
| 01650080 | 0.00000 | 18.2506 |
| 01650081 | 0.00000 | 17.8220 |
| 01650082 | 0.00000 | 17.0975 |
| 01650083 | 0.00000 | 16.0497 |
| 01650084 | 0.00000 | 18.2025 |
| 01650085 | 0.00000 | 18.9557 |
| 01650086 | 0.00000 | 18.9835 |
| 01650087 | 0.00000 | 18.9853 |
| 01650088 | 0.00000 | 19.0295 |
| 01650089 | 0.00000 | 19.0139 |
| 01650090 | 0.00000 | 19.0292 |