| Red | Green | Blue | |
| z | 17.63 | ||
| znorm | Inf | ||
| sky | -NaN | -NaN | -Inf |
| S/N | 45.1 | 76.0 | 81.7 |
| S/N(c) | 0.0 | 0.0 | 0.0 |
| SN(E/C) |
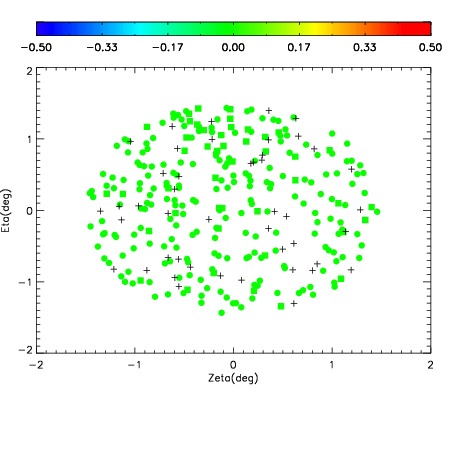
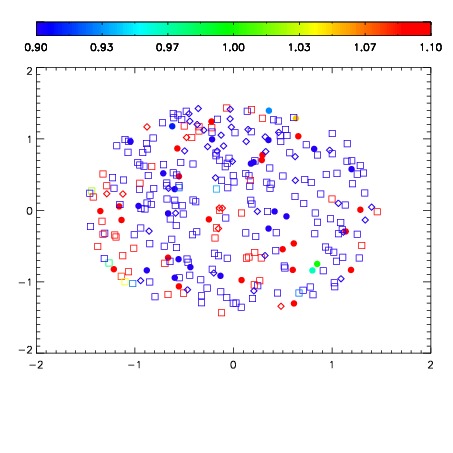
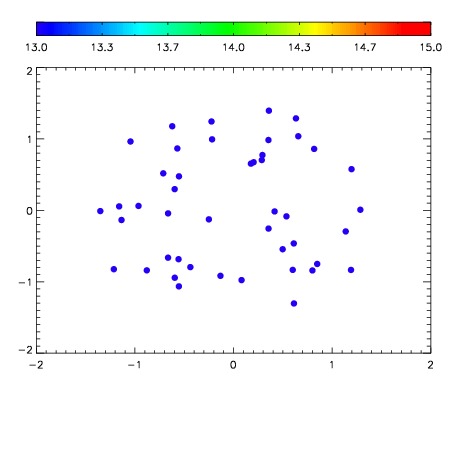

| Frame | Nreads | Zeropoints | Mag plots | Spatial mag deviation | Spatial sky 16325A emission deviations (filled: sky, open: star) | Spatial sky continuum emission | Spatial sky telluric CO2 absorption deviations (filled: H < 10) | |||||||||||||||||||||||
| 0 | 0 |
|
|
|
|
|
|
| 01660062 | 0.00000 | 19.0455 |
| 01660063 | 0.00000 | 19.0785 |
| 01660064 | 0.00000 | 19.0568 |
| 01660065 | 0.00000 | 18.9982 |
| 01660066 | 0.00000 | 19.0274 |
| 01660067 | 0.00000 | 19.0156 |
| 01660068 | 0.00000 | 19.0710 |
| 01660069 | 0.00000 | 19.1009 |
| 01660070 | 0.00000 | 19.0664 |
| 01660071 | 0.00000 | 19.0383 |
| 01660072 | 0.00000 | 19.0343 |