| Red | Green | Blue | |
| z | 17.64 | ||
| znorm | Inf | ||
| sky | -NaN | -NaN | -Inf |
| S/N | 28.8 | 48.1 | 51.0 |
| S/N(c) | 0.0 | 0.0 | 0.0 |
| SN(E/C) |

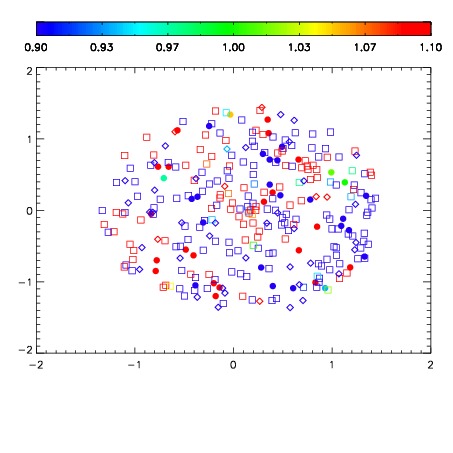
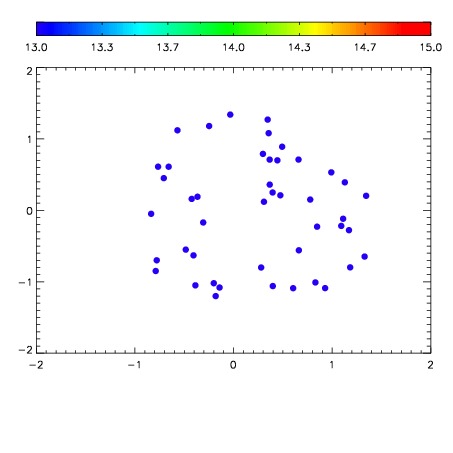

| Frame | Nreads | Zeropoints | Mag plots | Spatial mag deviation | Spatial sky 16325A emission deviations (filled: sky, open: star) | Spatial sky continuum emission | Spatial sky telluric CO2 absorption deviations (filled: H < 10) | |||||||||||||||||||||||
| 0 | 0 |
|
|
|
|
|
|
| 01930048 | 0.00000 | 18.8904 |
| 01930049 | 0.00000 | 18.7550 |
| 01930050 | 0.00000 | 18.7193 |
| 01930051 | 0.00000 | 18.8616 |
| 01930052 | 0.00000 | 17.8569 |
| 01930053 | 0.00000 | 18.6530 |
| 01930054 | 0.00000 | 18.5744 |