| Red | Green | Blue | |
| z | 17.64 | ||
| znorm | Inf | ||
| sky | -Inf | -Inf | -Inf |
| S/N | 18.3 | 30.9 | 34.6 |
| S/N(c) | 0.0 | 0.0 | 0.0 |
| SN(E/C) |
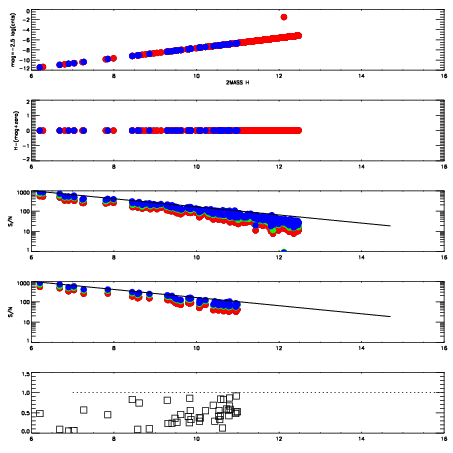
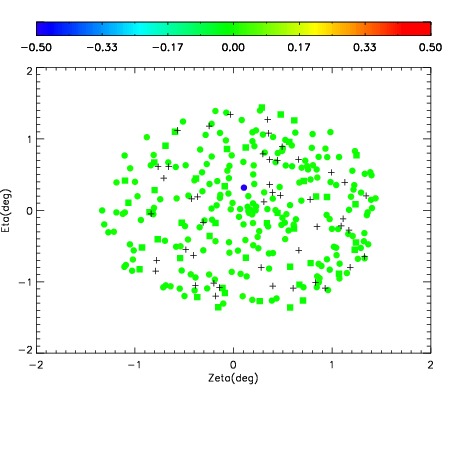
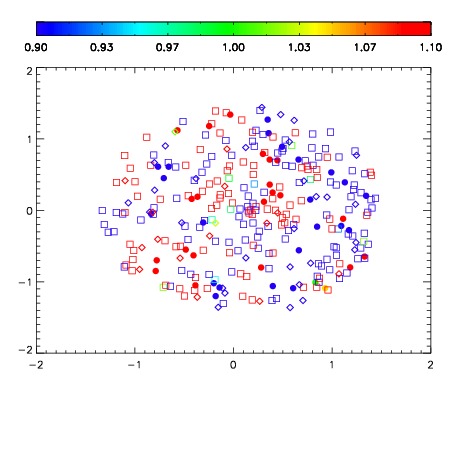
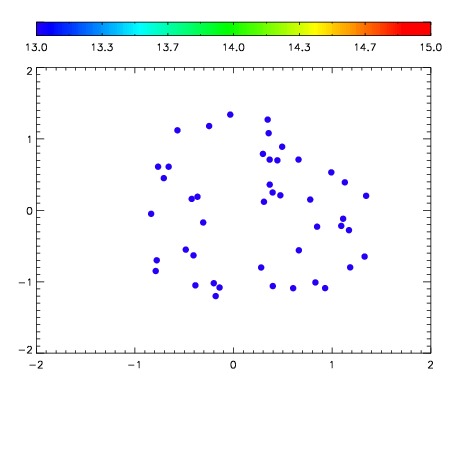

| Frame | Nreads | Zeropoints | Mag plots | Spatial mag deviation | Spatial sky 16325A emission deviations (filled: sky, open: star) | Spatial sky continuum emission | Spatial sky telluric CO2 absorption deviations (filled: H < 10) | |||||||||||||||||||||||
| 0 | 0 |
|
|
|
|
|
|
| 01970042 | 0.00000 | 18.6776 |
| 01970043 | 0.00000 | 18.4416 |
| 01970044 | 0.00000 | 18.0708 |
| 01970045 | 0.00000 | 17.5621 |
| 01970046 | 0.00000 | 18.4247 |
| 01970047 | 0.00000 | 18.1362 |
| 01970048 | 0.00000 | 14.2827 |