| Red | Green | Blue | |
| z | 17.64 | ||
| znorm | Inf | ||
| sky | -Inf | -Inf | -Inf |
| S/N | 17.9 | 33.1 | 36.3 |
| S/N(c) | 0.0 | 0.0 | 0.0 |
| SN(E/C) |

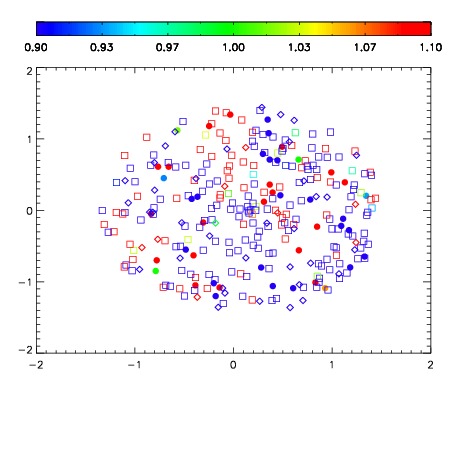


| Frame | Nreads | Zeropoints | Mag plots | Spatial mag deviation | Spatial sky 16325A emission deviations (filled: sky, open: star) | Spatial sky continuum emission | Spatial sky telluric CO2 absorption deviations (filled: H < 10) | |||||||||||||||||||||||
| 0 | 0 |
|
|
|
|
|
|
| IPAIR | NAME | SHIFT | NEWSHIFT | S/N | NAME | SHIFT | NEWSHIFT | S/N |
| 0 | 02420048 | 0.422523 | 0.00000 | 17.9539 | 02420046 | 0.00502810 | 0.417495 | 18.4649 |
| 1 | 02420043 | 0.417922 | 0.00460100 | 19.0375 | 02420042 | 0.00000 | 0.422523 | 18.9486 |
| 2 | 02420044 | 0.420063 | 0.00246000 | 18.9210 | 02420049 | 0.00457584 | 0.417947 | 18.5871 |
| 3 | 02420047 | 0.422417 | 0.000105977 | 17.0332 | 02420045 | 0.00728062 | 0.415242 | 15.9264 |