| Red | Green | Blue | |
| z | 17.64 | ||
| znorm | Inf | ||
| sky | -NaN | -Inf | -Inf |
| S/N | 5.9 | 13.6 | 14.0 |
| S/N(c) | 0.0 | 0.0 | 0.0 |
| SN(E/C) |
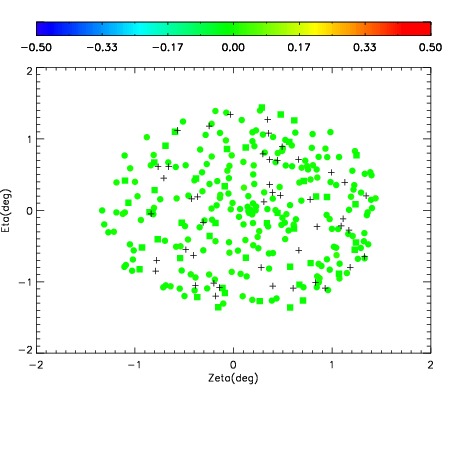
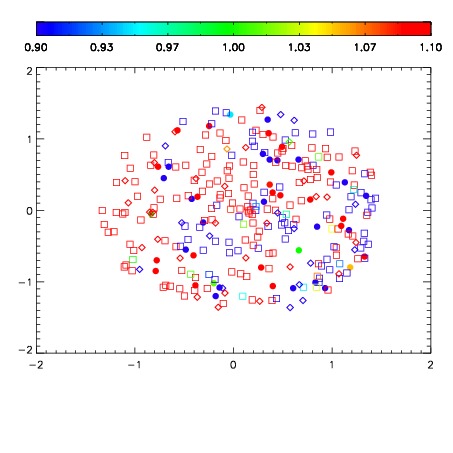


| Frame | Nreads | Zeropoints | Mag plots | Spatial mag deviation | Spatial sky 16325A emission deviations (filled: sky, open: star) | Spatial sky continuum emission | Spatial sky telluric CO2 absorption deviations (filled: H < 10) | |||||||||||||||||||||||
| 0 | 0 |
|
|
|
|
|
|
| IPAIR | NAME | SHIFT | NEWSHIFT | S/N | NAME | SHIFT | NEWSHIFT | S/N |
| 0 | 03060010 | 0.498900 | 0.00000 | 17.1914 | 03060011 | -0.000865058 | 0.499765 | 16.9990 |
| 1 | 03060009 | 0.498077 | 0.000822991 | 17.2478 | 03060008 | 0.00000 | 0.498900 | 17.2666 |
| 2 | 03060013 | 0.491805 | 0.00709501 | 16.9229 | 03060012 | -0.00301390 | 0.501914 | 16.9687 |
| 3 | 03060014 | 0.493013 | 0.00588700 | 16.8284 | 03060015 | -0.000163577 | 0.499064 | 16.9452 |