| Red | Green | Blue | |
| z | 17.64 | ||
| znorm | Inf | ||
| sky | -NaN | -NaN | -Inf |
| S/N | 27.2 | 49.2 | 51.9 |
| S/N(c) | 0.0 | 0.0 | 0.0 |
| SN(E/C) |


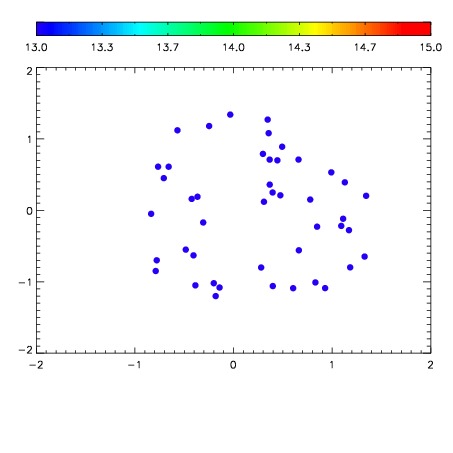

| Frame | Nreads | Zeropoints | Mag plots | Spatial mag deviation | Spatial sky 16325A emission deviations (filled: sky, open: star) | Spatial sky continuum emission | Spatial sky telluric CO2 absorption deviations (filled: H < 10) | |||||||||||||||||||||||
| 0 | 0 |
|
|
|
|
|
|
| IPAIR | NAME | SHIFT | NEWSHIFT | S/N | NAME | SHIFT | NEWSHIFT | S/N |
| 0 | 03070010 | 0.496127 | 0.00000 | 19.1186 | 03070011 | 0.00164290 | 0.494484 | 19.1341 |
| 1 | 03070013 | 0.495782 | 0.000345021 | 19.1074 | 03070015 | -0.00209935 | 0.498226 | 19.0859 |
| 2 | 03070014 | 0.495807 | 0.000320017 | 19.1062 | 03070012 | -0.00167278 | 0.497800 | 19.0790 |
| 3 | 03070009 | 0.495733 | 0.000394017 | 19.0270 | 03070008 | 0.00000 | 0.496127 | 19.0737 |