| Red | Green | Blue | |
| z | 17.63 | ||
| znorm | Inf | ||
| sky | -NaN | -Inf | -Inf |
| S/N | 33.6 | 55.3 | 59.3 |
| S/N(c) | 0.0 | 0.0 | 0.0 |
| SN(E/C) |


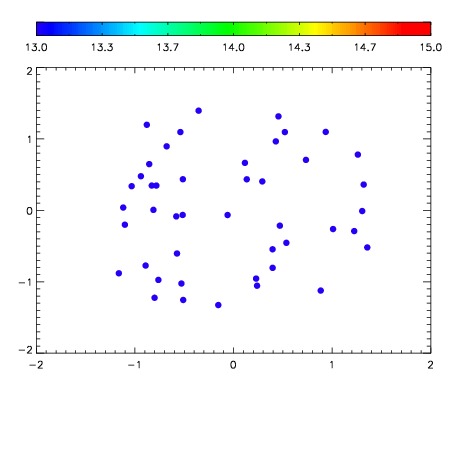

| Frame | Nreads | Zeropoints | Mag plots | Spatial mag deviation | Spatial sky 16325A emission deviations (filled: sky, open: star) | Spatial sky continuum emission | Spatial sky telluric CO2 absorption deviations (filled: H < 10) | |||||||||||||||||||||||
| 0 | 0 |
|
|
|
|
|
|
| 01960051 | 0.00000 | 19.0127 |
| 01960052 | 0.00000 | 18.9303 |
| 01960053 | 0.00000 | 18.9885 |
| 01960054 | 0.00000 | 19.0127 |
| 01960055 | 0.00000 | 18.9748 |
| 01960056 | 0.00000 | 19.0088 |
| 01960057 | 0.00000 | 19.0260 |