| Red | Green | Blue | |
| z | 17.64 | ||
| znorm | Inf | ||
| sky | -Inf | -Inf | -Inf |
| S/N | 33.2 | 48.2 | 50.7 |
| S/N(c) | 0.0 | 0.0 | 0.0 |
| SN(E/C) |
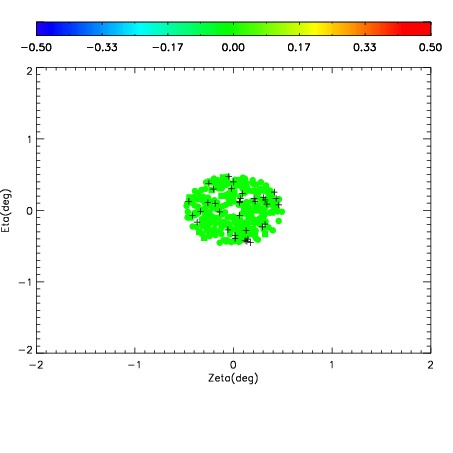
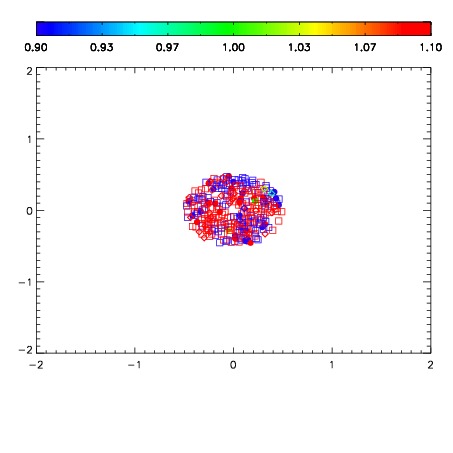
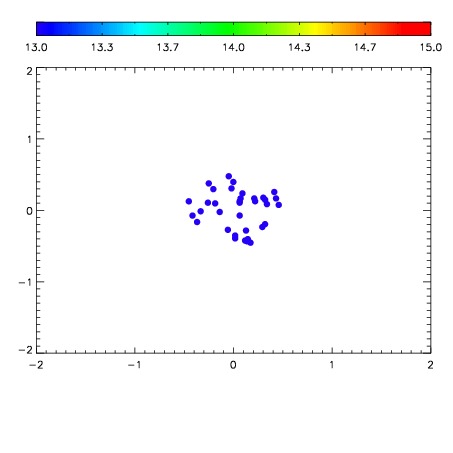

| Frame | Nreads | Zeropoints | Mag plots | Spatial mag deviation | Spatial sky 16325A emission deviations (filled: sky, open: star) | Spatial sky continuum emission | Spatial sky telluric CO2 absorption deviations (filled: H < 10) | |||||||||||||||||||||||
| 0 | 0 |
|
|
|
|
|
|
| 01700013 | 0.00000 | 18.4921 |
| 01700014 | 0.00000 | 18.4324 |
| 01700015 | 0.00000 | 18.3547 |
| 01700016 | 0.00000 | 18.3352 |
| 01700017 | 0.00000 | 18.4508 |
| 01700018 | 0.00000 | 18.1623 |
| 01700019 | 0.00000 | 18.4709 |
| 01700020 | 0.00000 | 18.5033 |