| Red | Green | Blue | |
| z | 17.64 | ||
| znorm | Inf | ||
| sky | -Inf | -NaN | -Inf |
| S/N | 25.1 | 37.7 | 39.9 |
| S/N(c) | 0.0 | 0.0 | 0.0 |
| SN(E/C) |
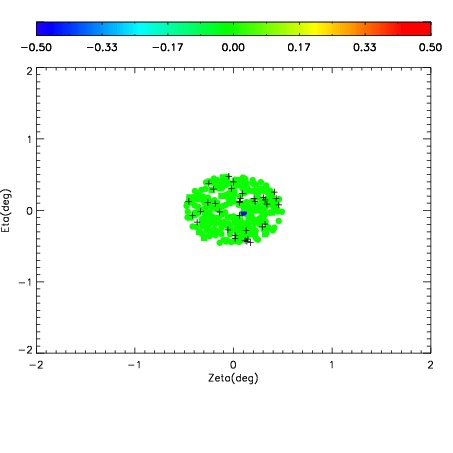
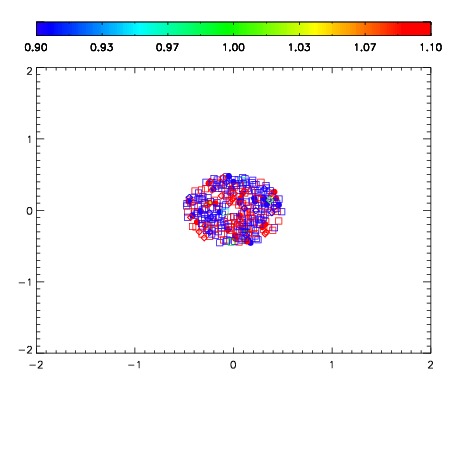
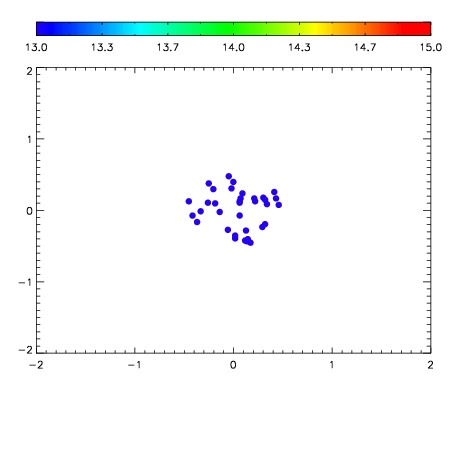

| Frame | Nreads | Zeropoints | Mag plots | Spatial mag deviation | Spatial sky 16325A emission deviations (filled: sky, open: star) | Spatial sky continuum emission | Spatial sky telluric CO2 absorption deviations (filled: H < 10) | |||||||||||||||||||||||
| 0 | 0 |
|
|
|
|
|
|
| IPAIR | NAME | SHIFT | NEWSHIFT | S/N | NAME | SHIFT | NEWSHIFT | S/N |
| 0 | 12660054 | 0.486917 | 0.00000 | 18.5852 | 12660055 | 0.00134354 | 0.485573 | 18.4643 |
| 1 | 12660049 | 0.481862 | 0.00505498 | 18.8066 | 12660048 | 0.00000 | 0.486917 | 18.9415 |
| 2 | 12660053 | 0.483770 | 0.00314698 | 18.6491 | 12660052 | -0.00135174 | 0.488269 | 18.6385 |
| 3 | 12660050 | 0.483735 | 0.00318199 | 18.0438 | 12660051 | -0.00172844 | 0.488645 | 17.9750 |