| Red | Green | Blue | |
| z | 17.64 | ||
| znorm | Inf | ||
| sky | -Inf | -NaN | -Inf |
| S/N | 24.8 | 38.8 | 41.2 |
| S/N(c) | 0.0 | 0.0 | 0.0 |
| SN(E/C) |
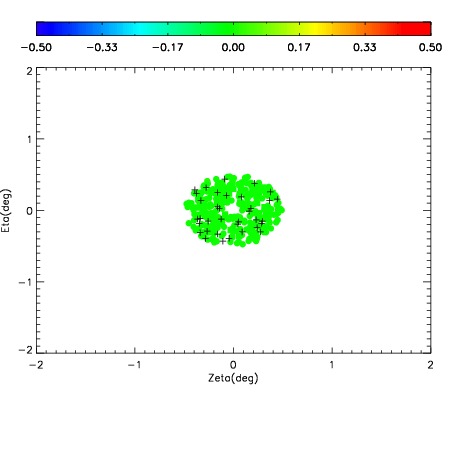
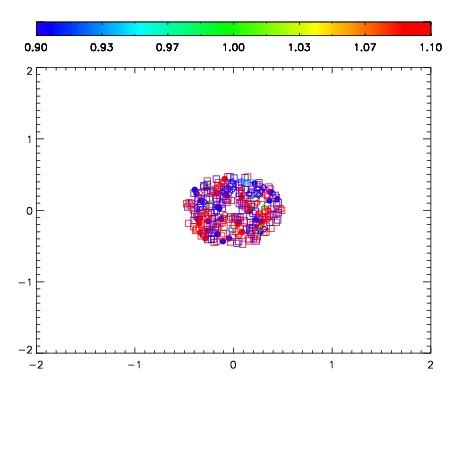
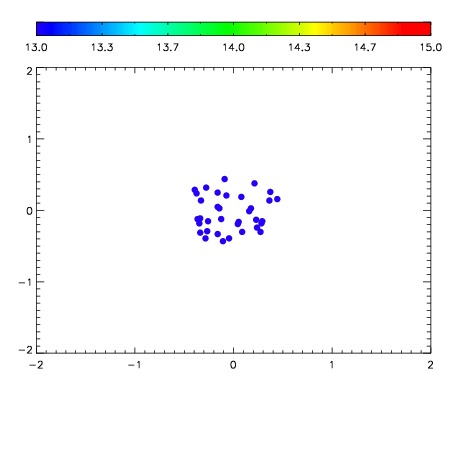

| Frame | Nreads | Zeropoints | Mag plots | Spatial mag deviation | Spatial sky 16325A emission deviations (filled: sky, open: star) | Spatial sky continuum emission | Spatial sky telluric CO2 absorption deviations (filled: H < 10) | |||||||||||||||||||||||
| 0 | 0 |
|
|
|
|
|
|
| IPAIR | NAME | SHIFT | NEWSHIFT | S/N | NAME | SHIFT | NEWSHIFT | S/N |
| 0 | 12660043 | 0.482727 | 0.00000 | 18.7989 | 12660044 | -0.00255730 | 0.485284 | 18.8734 |
| 1 | 12660042 | 0.481181 | 0.00154600 | 18.6968 | 12660041 | -0.00354563 | 0.486273 | 18.6312 |
| 2 | 12660039 | 0.479757 | 0.00296998 | 18.4920 | 12660040 | -0.00304092 | 0.485768 | 18.3189 |
| 3 | 12660038 | 0.481347 | 0.00138000 | 18.2723 | 12660037 | 0.00000 | 0.482727 | 18.2903 |