| Red | Green | Blue | |
| z | 17.64 | ||
| znorm | Inf | ||
| sky | -Inf | -Inf | -Inf |
| S/N | 32.9 | 47.9 | 48.8 |
| S/N(c) | 0.0 | 0.0 | 0.0 |
| SN(E/C) |


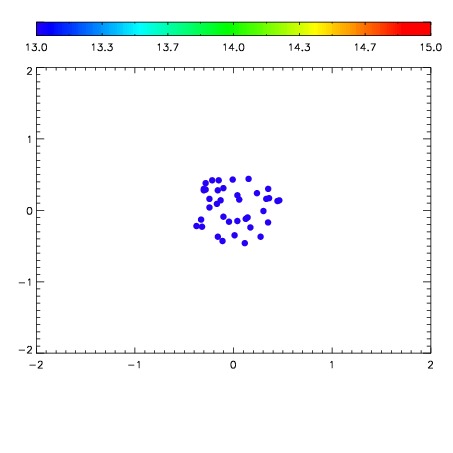

| Frame | Nreads | Zeropoints | Mag plots | Spatial mag deviation | Spatial sky 16325A emission deviations (filled: sky, open: star) | Spatial sky continuum emission | Spatial sky telluric CO2 absorption deviations (filled: H < 10) | |||||||||||||||||||||||
| 0 | 0 |
|
|
|
|
|
|
| IPAIR | NAME | SHIFT | NEWSHIFT | S/N | NAME | SHIFT | NEWSHIFT | S/N |
| 0 | 12710030 | 0.481513 | 0.00000 | 18.8485 | 12710028 | 0.00000 | 0.481513 | 18.8620 |
| 1 | 12710029 | 0.480967 | 0.000546008 | 18.9864 | 12710032 | -0.00412594 | 0.485639 | 19.0048 |
| 2 | 12710034 | 0.481306 | 0.000207007 | 18.9220 | 12710035 | -0.00404878 | 0.485562 | 18.9687 |
| 3 | 12710033 | 0.480384 | 0.00112900 | 18.9134 | 12710031 | -0.00298667 | 0.484500 | 18.9647 |