| Red | Green | Blue | |
| z | 17.64 | ||
| znorm | Inf | ||
| sky | -Inf | -NaN | -Inf |
| S/N | 26.6 | 39.8 | 40.9 |
| S/N(c) | 0.0 | 0.0 | 0.0 |
| SN(E/C) |
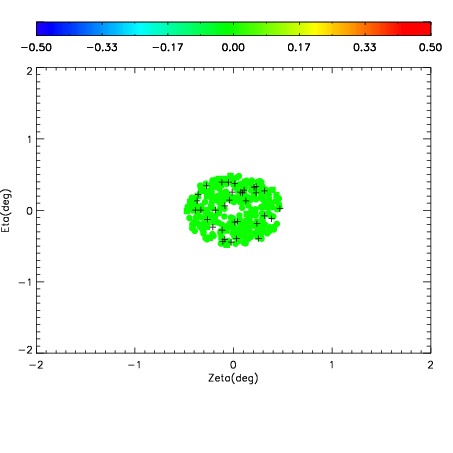

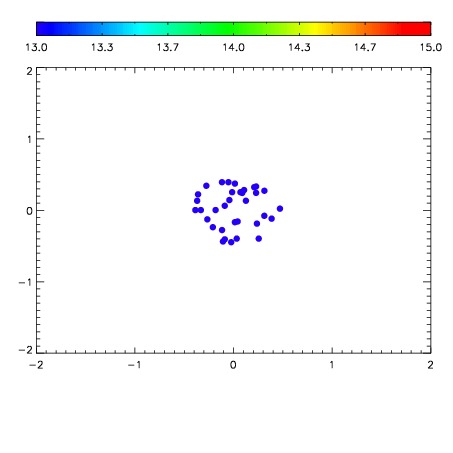

| Frame | Nreads | Zeropoints | Mag plots | Spatial mag deviation | Spatial sky 16325A emission deviations (filled: sky, open: star) | Spatial sky continuum emission | Spatial sky telluric CO2 absorption deviations (filled: H < 10) | |||||||||||||||||||||||
| 0 | 0 |
|
|
|
|
|
|
| IPAIR | NAME | SHIFT | NEWSHIFT | S/N | NAME | SHIFT | NEWSHIFT | S/N |
| 0 | 12710023 | 0.490183 | 0.00000 | 18.7219 | 12710020 | 4.14373e-05 | 0.490142 | 18.7799 |
| 1 | 12710022 | 0.489641 | 0.000541985 | 18.6984 | 12710024 | 0.00121686 | 0.488966 | 18.7357 |
| 2 | 12710019 | 0.487655 | 0.00252798 | 18.6660 | 12710021 | 8.36505e-05 | 0.490099 | 18.7007 |
| 3 | 12710018 | 0.488088 | 0.00209498 | 18.3739 | 12710017 | 0.00000 | 0.490183 | 18.2855 |