| Red | Green | Blue | |
| z | 17.64 | ||
| znorm | Inf | ||
| sky | -NaN | -Inf | -Inf |
| S/N | 36.4 | 51.6 | 53.1 |
| S/N(c) | 0.0 | 0.0 | 0.0 |
| SN(E/C) |
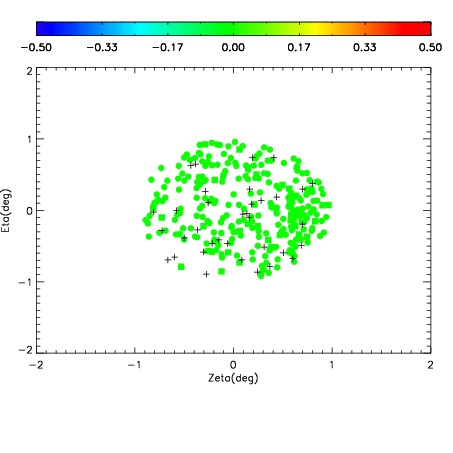
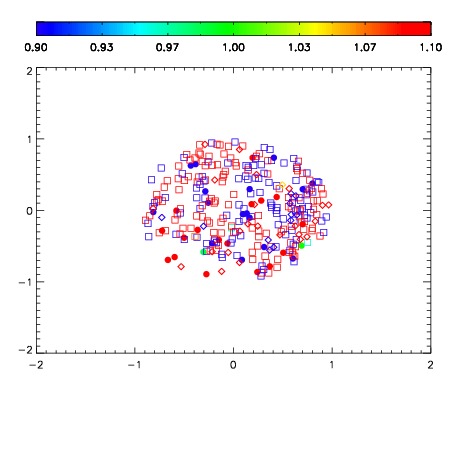
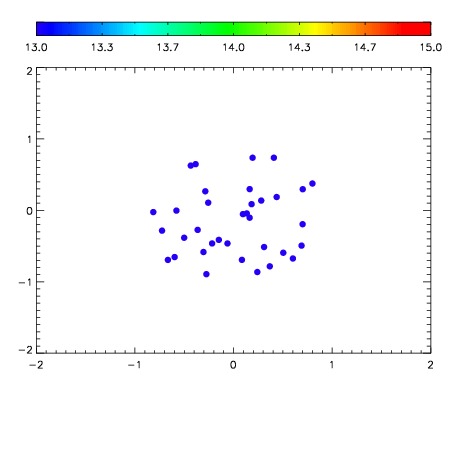

| Frame | Nreads | Zeropoints | Mag plots | Spatial mag deviation | Spatial sky 16325A emission deviations (filled: sky, open: star) | Spatial sky continuum emission | Spatial sky telluric CO2 absorption deviations (filled: H < 10) | |||||||||||||||||||||||
| 0 | 0 |
|
|
|
|
|
|
| 01700026 | 0.00000 | 18.5704 |
| 01700027 | 0.00000 | 18.5402 |
| 01700028 | 0.00000 | 18.5177 |
| 01700029 | 0.00000 | 18.6027 |
| 01700030 | 0.00000 | 18.6998 |
| 01700031 | 0.00000 | 18.6184 |
| 01700032 | 0.00000 | 18.6212 |
| 01700033 | 0.00000 | 18.6085 |