| Red | Green | Blue | |
| z | 17.64 | ||
| znorm | Inf | ||
| sky | -NaN | -NaN | -Inf |
| S/N | 36.0 | 49.1 | 51.1 |
| S/N(c) | 0.0 | 0.0 | 0.0 |
| SN(E/C) |
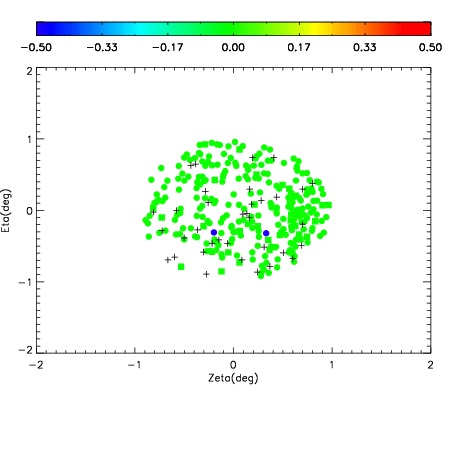
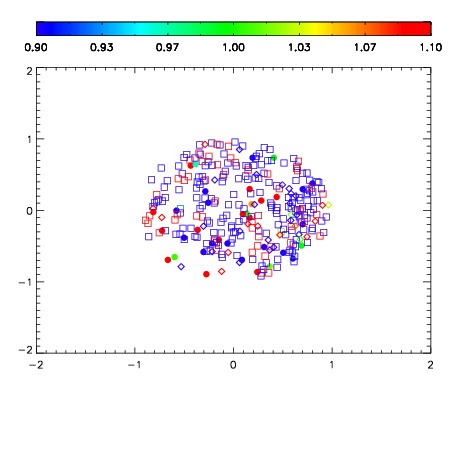


| Frame | Nreads | Zeropoints | Mag plots | Spatial mag deviation | Spatial sky 16325A emission deviations (filled: sky, open: star) | Spatial sky continuum emission | Spatial sky telluric CO2 absorption deviations (filled: H < 10) | |||||||||||||||||||||||
| 0 | 0 |
|
|
|
|
|
|
| IPAIR | NAME | SHIFT | NEWSHIFT | S/N | NAME | SHIFT | NEWSHIFT | S/N |
| 0 | 12730035 | 0.480731 | 0.00000 | 19.1599 | 12730040 | -0.00232051 | 0.483052 | 19.1760 |
| 1 | 12730039 | 0.479493 | 0.00123802 | 19.1140 | 12730036 | -0.00176515 | 0.482496 | 19.1605 |
| 2 | 12730034 | 0.480709 | 2.20239e-05 | 19.1109 | 12730033 | 0.00000 | 0.480731 | 19.0676 |
| 3 | 12730038 | 0.479190 | 0.00154102 | 19.0694 | 12730037 | -0.00257143 | 0.483302 | 19.0481 |