| Red | Green | Blue | |
| z | 17.63 | ||
| znorm | Inf | ||
| sky | -NaN | -NaN | -NaN |
| S/N | 33.3 | 50.3 | 54.0 |
| S/N(c) | 0.0 | 0.0 | 0.0 |
| SN(E/C) |
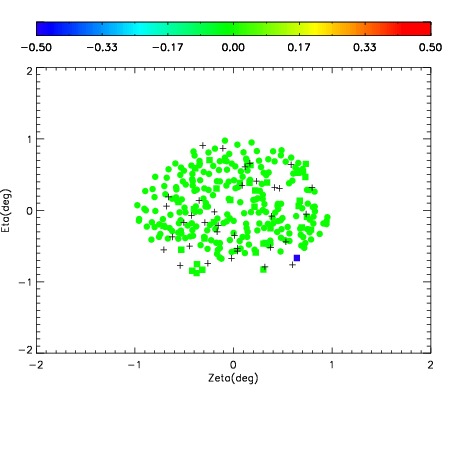
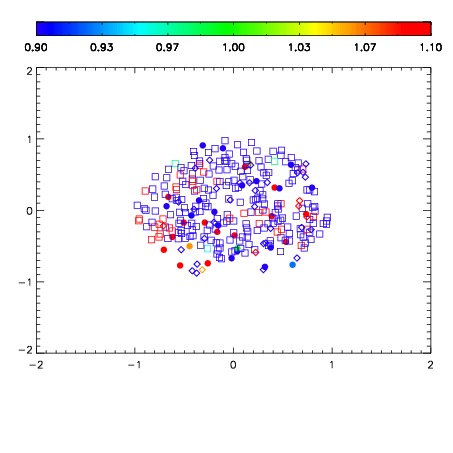
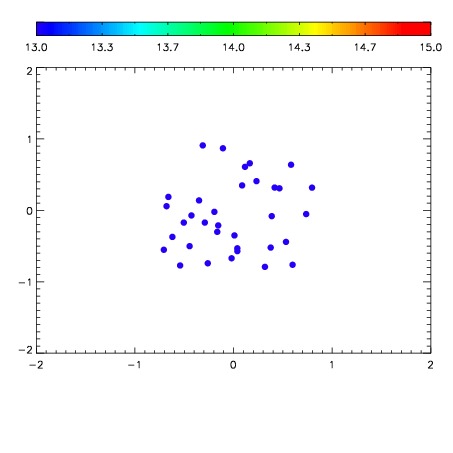

| Frame | Nreads | Zeropoints | Mag plots | Spatial mag deviation | Spatial sky 16325A emission deviations (filled: sky, open: star) | Spatial sky continuum emission | Spatial sky telluric CO2 absorption deviations (filled: H < 10) | |||||||||||||||||||||||
| 0 | 0 |
|
|
|
|
|
|
| IPAIR | NAME | SHIFT | NEWSHIFT | S/N | NAME | SHIFT | NEWSHIFT | S/N |
| 0 | 12730050 | 0.483529 | 0.00000 | 19.0419 | 12730048 | -0.000544885 | 0.484074 | 18.8433 |
| 1 | 12730049 | 0.483073 | 0.000456005 | 19.1860 | 12730047 | -0.00184233 | 0.485371 | 19.1662 |
| 2 | 12730045 | 0.479466 | 0.00406301 | 19.1513 | 12730044 | 0.00000 | 0.483529 | 19.1430 |
| 3 | 12730046 | 0.480513 | 0.00301600 | 19.1311 | 12730051 | -0.000688591 | 0.484218 | 19.0916 |