| Red | Green | Blue | |
| z | 17.63 | ||
| znorm | Inf | ||
| sky | -NaN | -NaN | -Inf |
| S/N | 23.6 | 41.6 | 45.0 |
| S/N(c) | 0.0 | 0.0 | 0.0 |
| SN(E/C) |
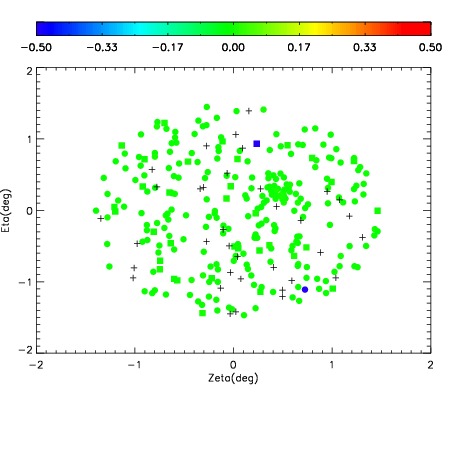
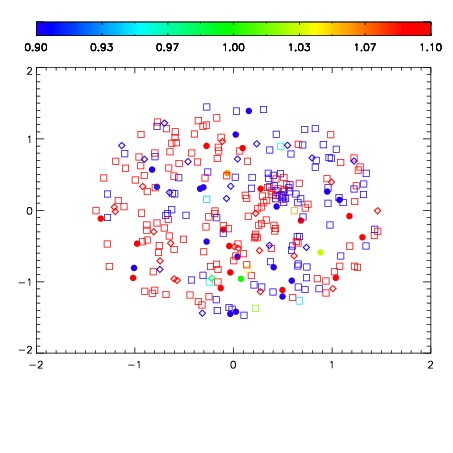
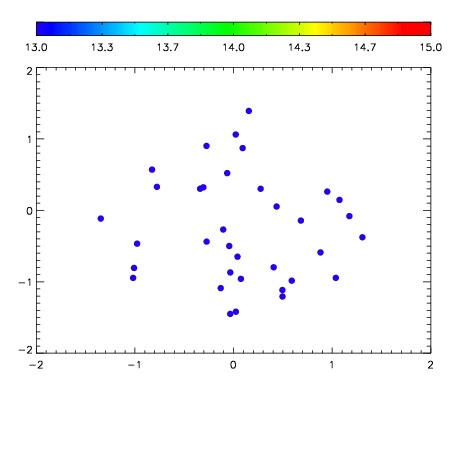

| Frame | Nreads | Zeropoints | Mag plots | Spatial mag deviation | Spatial sky 16325A emission deviations (filled: sky, open: star) | Spatial sky continuum emission | Spatial sky telluric CO2 absorption deviations (filled: H < 10) | |||||||||||||||||||||||
| 0 | 0 |
|
|
|
|
|
|
| IPAIR | NAME | SHIFT | NEWSHIFT | S/N | NAME | SHIFT | NEWSHIFT | S/N |
| 0 | 03120038 | 0.496404 | 0.00000 | 18.9461 | 03120039 | 0.00397753 | 0.492426 | 18.7119 |
| 1 | 03120042 | 0.494554 | 0.00184998 | 19.0886 | 03120043 | 0.00146840 | 0.494936 | 19.0194 |
| 2 | 03120037 | 0.495123 | 0.00128099 | 19.0236 | 03120036 | 0.00000 | 0.496404 | 18.9674 |
| 3 | 03120041 | 0.493548 | 0.00285599 | 18.8135 | 03120040 | 0.000897139 | 0.495507 | 18.5973 |