| Red | Green | Blue | |
| z | 17.63 | ||
| znorm | Inf | ||
| sky | -NaN | -NaN | -Inf |
| S/N | 26.8 | 46.9 | 48.9 |
| S/N(c) | 0.0 | 0.0 | 0.0 |
| SN(E/C) |
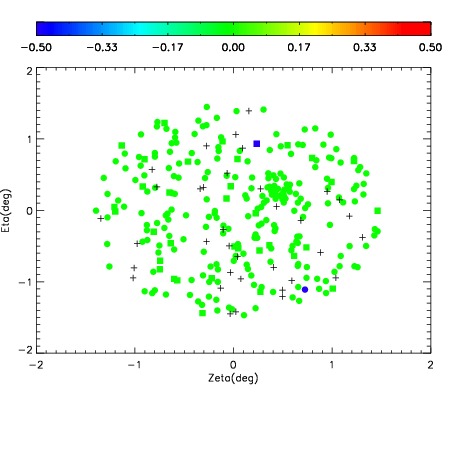
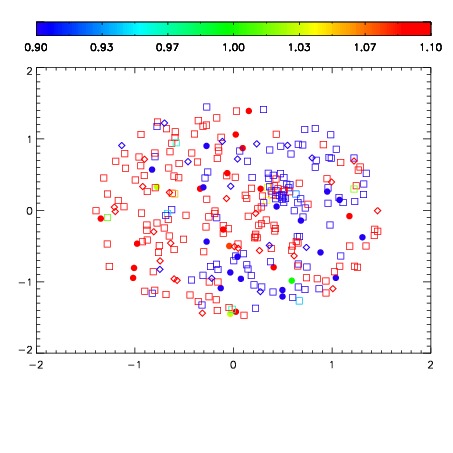


| Frame | Nreads | Zeropoints | Mag plots | Spatial mag deviation | Spatial sky 16325A emission deviations (filled: sky, open: star) | Spatial sky continuum emission | Spatial sky telluric CO2 absorption deviations (filled: H < 10) | |||||||||||||||||||||||
| 0 | 0 |
|
|
|
|
|
|
| IPAIR | NAME | SHIFT | NEWSHIFT | S/N | NAME | SHIFT | NEWSHIFT | S/N |
| 0 | 10810017 | 0.488870 | 0.00000 | 19.0769 | 10810018 | -0.00140781 | 0.490278 | 19.0723 |
| 1 | 10810016 | 0.488608 | 0.000261992 | 19.0748 | 10810015 | -0.000963126 | 0.489833 | 19.0325 |
| 2 | 10810013 | 0.486506 | 0.00236401 | 19.0106 | 10810014 | -0.00126443 | 0.490134 | 19.0267 |
| 3 | 10810012 | 0.486377 | 0.00249299 | 18.9592 | 10810011 | 0.00000 | 0.488870 | 18.8498 |