| Red | Green | Blue | |
| z | 17.63 | ||
| znorm | Inf | ||
| sky | -NaN | -NaN | -Inf |
| S/N | 27.9 | 47.7 | 50.1 |
| S/N(c) | 0.0 | 0.0 | 0.0 |
| SN(E/C) |
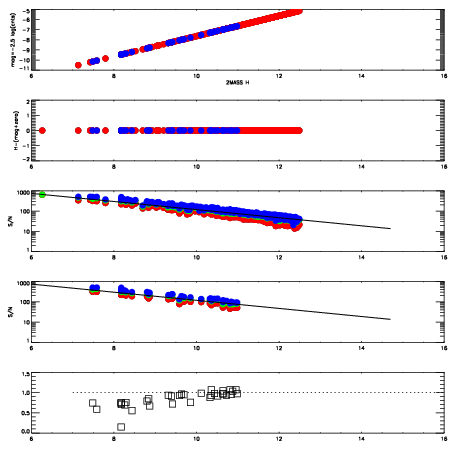
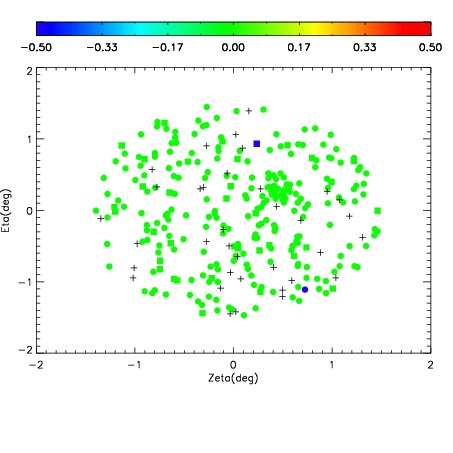
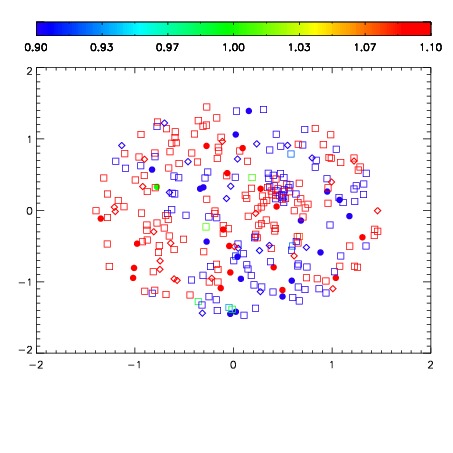


| Frame | Nreads | Zeropoints | Mag plots | Spatial mag deviation | Spatial sky 16325A emission deviations (filled: sky, open: star) | Spatial sky continuum emission | Spatial sky telluric CO2 absorption deviations (filled: H < 10) | |||||||||||||||||||||||
| 0 | 0 |
|
|
|
|
|
|
| IPAIR | NAME | SHIFT | NEWSHIFT | S/N | NAME | SHIFT | NEWSHIFT | S/N |
| 0 | 10890016 | 0.509431 | 0.00000 | 19.0629 | 10890014 | 0.00131045 | 0.508121 | 19.1164 |
| 1 | 10890013 | 0.507966 | 0.00146502 | 19.1232 | 10890015 | 0.00201003 | 0.507421 | 19.1255 |
| 2 | 10890017 | 0.509323 | 0.000108004 | 19.0273 | 10890018 | 0.00220033 | 0.507231 | 19.0782 |
| 3 | 10890012 | 0.508484 | 0.000946999 | 19.0231 | 10890011 | 0.00000 | 0.509431 | 19.0024 |