| Red | Green | Blue | |
| z | 17.63 | ||
| znorm | Inf | ||
| sky | -NaN | -NaN | -Inf |
| S/N | 20.0 | 37.3 | 41.0 |
| S/N(c) | 0.0 | 0.0 | 0.0 |
| SN(E/C) |
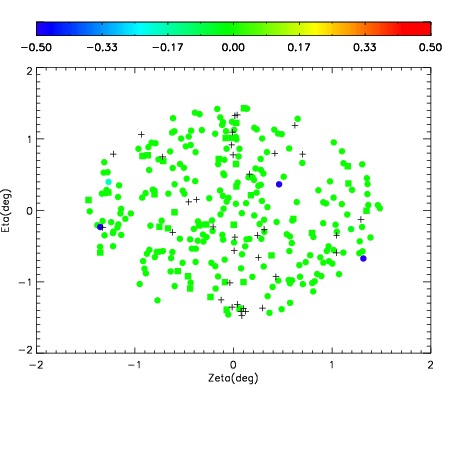
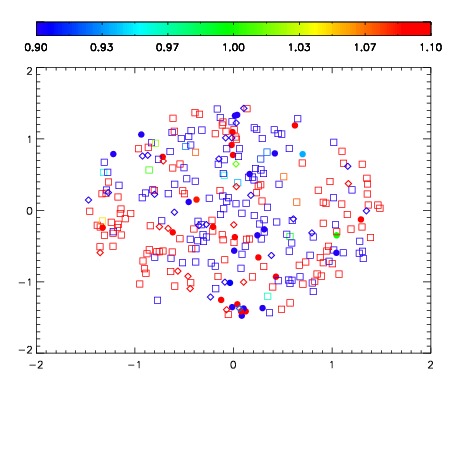
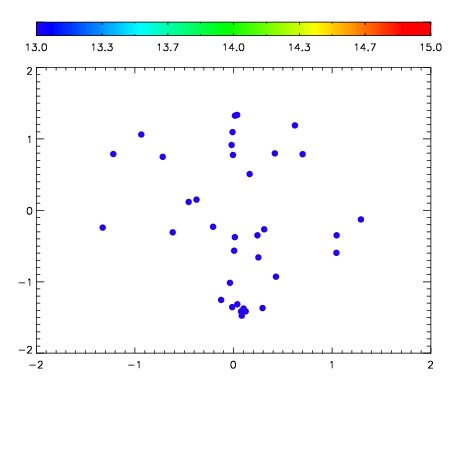

| Frame | Nreads | Zeropoints | Mag plots | Spatial mag deviation | Spatial sky 16325A emission deviations (filled: sky, open: star) | Spatial sky continuum emission | Spatial sky telluric CO2 absorption deviations (filled: H < 10) | |||||||||||||||||||||||
| 0 | 0 |
|
|
|
|
|
|
| IPAIR | NAME | SHIFT | NEWSHIFT | S/N | NAME | SHIFT | NEWSHIFT | S/N |
| 0 | 02590039 | 0.416291 | 0.00000 | 18.9360 | 02590044 | -0.00362546 | 0.419916 | 18.8953 |
| 1 | 02590038 | 0.415565 | 0.000725985 | 18.9358 | 02590041 | -0.00714070 | 0.423432 | 18.8039 |
| 2 | 02590043 | 0.414409 | 0.00188199 | 18.8278 | 02590037 | 0.00000 | 0.416291 | 18.7713 |
| 3 | 02590042 | 0.411493 | 0.00479800 | 18.8115 | 02590040 | -0.00227649 | 0.418567 | 18.7709 |