| Red | Green | Blue | |
| z | 17.63 | ||
| znorm | Inf | ||
| sky | -Inf | -Inf | -Inf |
| S/N | 11.2 | 21.6 | 24.2 |
| S/N(c) | 0.0 | 0.0 | 0.0 |
| SN(E/C) |
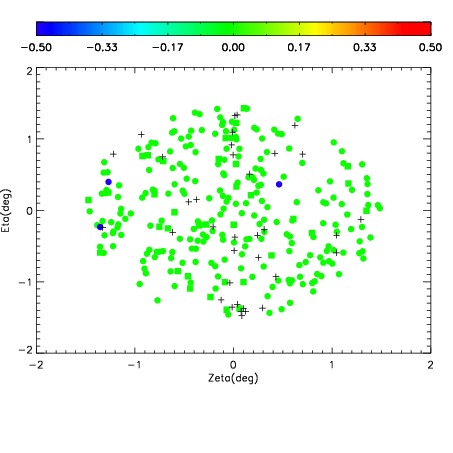
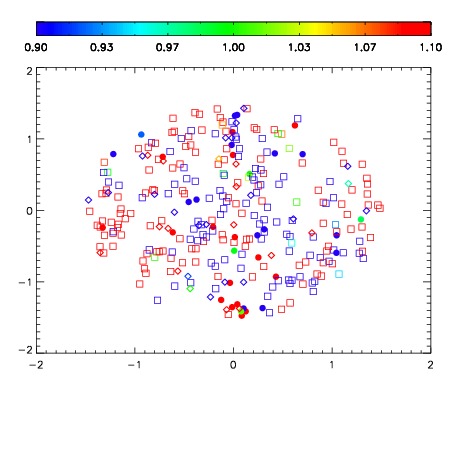
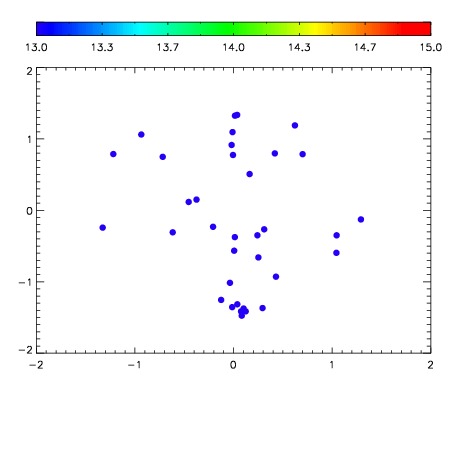

| Frame | Nreads | Zeropoints | Mag plots | Spatial mag deviation | Spatial sky 16325A emission deviations (filled: sky, open: star) | Spatial sky continuum emission | Spatial sky telluric CO2 absorption deviations (filled: H < 10) | |||||||||||||||||||||||
| 0 | 0 |
|
|
|
|
|
|
| IPAIR | NAME | SHIFT | NEWSHIFT | S/N | NAME | SHIFT | NEWSHIFT | S/N |
| 0 | 02620046 | 0.422748 | 0.00000 | 18.5998 | 02620043 | 0.000114217 | 0.422634 | 18.2363 |
| 1 | 02620042 | 0.421758 | 0.000990003 | 18.2865 | 02620040 | 0.00000 | 0.422748 | 17.9048 |
| 2 | 02620041 | 0.420116 | 0.00263199 | 18.0058 | 02620047 | -0.00105957 | 0.423808 | 17.6973 |
| 3 | 02620045 | 0.418402 | 0.00434601 | 17.0529 | 02620044 | -0.00366914 | 0.426417 | 17.1901 |