| Red | Green | Blue | |
| z | 17.63 | ||
| znorm | Inf | ||
| sky | -NaN | -NaN | -Inf |
| S/N | 25.4 | 44.5 | 48.2 |
| S/N(c) | 0.0 | 0.0 | 0.0 |
| SN(E/C) |
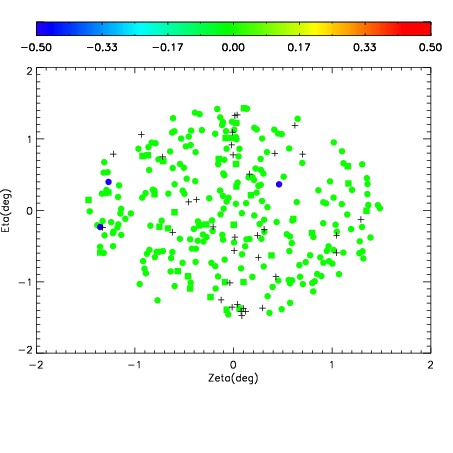
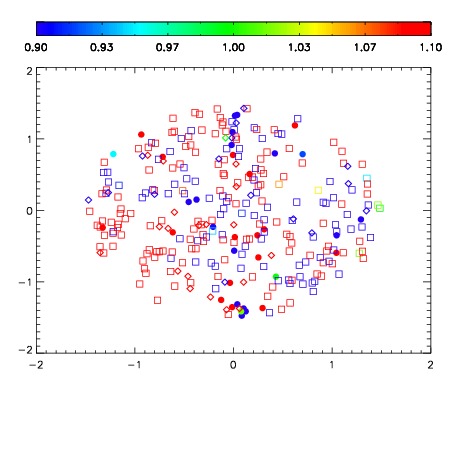
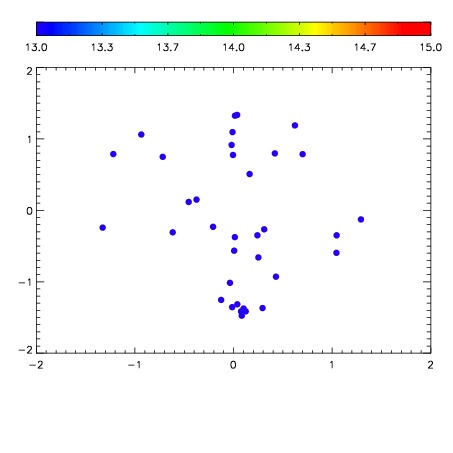

| Frame | Nreads | Zeropoints | Mag plots | Spatial mag deviation | Spatial sky 16325A emission deviations (filled: sky, open: star) | Spatial sky continuum emission | Spatial sky telluric CO2 absorption deviations (filled: H < 10) | |||||||||||||||||||||||
| 0 | 0 |
|
|
|
|
|
|
| IPAIR | NAME | SHIFT | NEWSHIFT | S/N | NAME | SHIFT | NEWSHIFT | S/N |
| 0 | 02780061 | 0.422781 | 0.00000 | 18.8809 | 02780059 | -0.00214766 | 0.424929 | 18.7787 |
| 1 | 02780057 | 0.422398 | 0.000382990 | 19.0243 | 02780054 | 0.00565239 | 0.417129 | 18.9826 |
| 2 | 02780056 | 0.418041 | 0.00474000 | 18.9850 | 02780055 | -0.000251826 | 0.423033 | 18.9680 |
| 3 | 02780052 | 0.417869 | 0.00491199 | 18.9710 | 02780058 | 0.00546382 | 0.417317 | 18.9344 |
| 4 | 02780053 | 0.418638 | 0.00414300 | 18.9295 | 02780062 | 0.00545736 | 0.417324 | 18.7997 |
| 5 | 02780060 | 0.419400 | 0.00338098 | 18.8222 | 02780051 | 0.00000 | 0.422781 | 18.2834 |