| Red | Green | Blue | |
| z | 17.64 | ||
| znorm | Inf | ||
| sky | -Inf | -Inf | -Inf |
| S/N | 17.5 | 32.2 | 36.4 |
| S/N(c) | 0.0 | 0.0 | 0.0 |
| SN(E/C) |
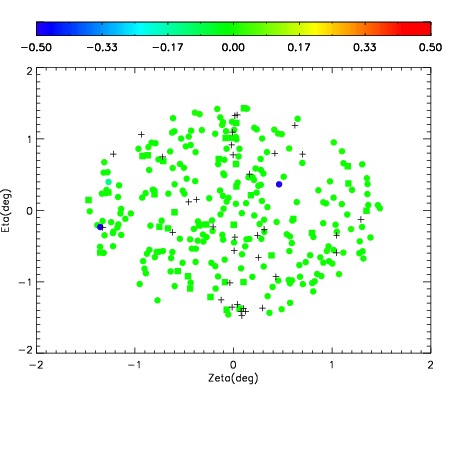
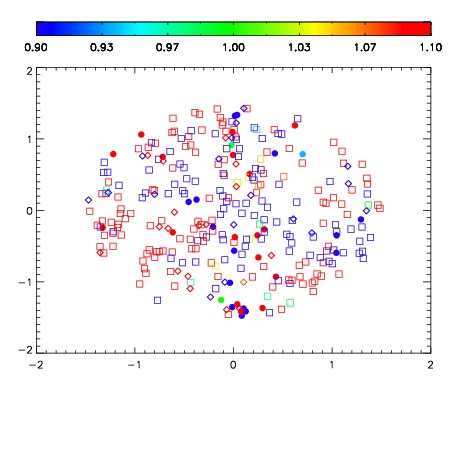
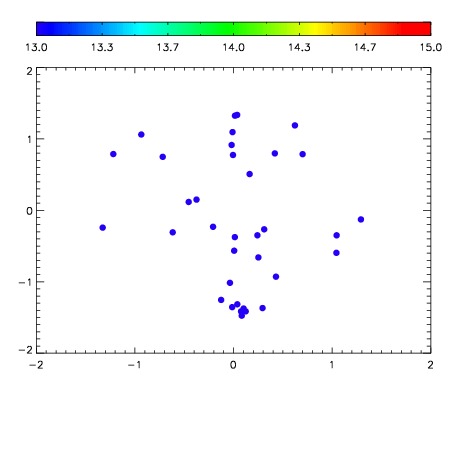

| Frame | Nreads | Zeropoints | Mag plots | Spatial mag deviation | Spatial sky 16325A emission deviations (filled: sky, open: star) | Spatial sky continuum emission | Spatial sky telluric CO2 absorption deviations (filled: H < 10) | |||||||||||||||||||||||
| 0 | 0 |
|
|
|
|
|
|
| IPAIR | NAME | SHIFT | NEWSHIFT | S/N | NAME | SHIFT | NEWSHIFT | S/N |
| 0 | 02820052 | 0.414199 | 0.00000 | 17.8576 | 02820053 | 0.00176417 | 0.412435 | 17.8676 |
| 1 | 02820047 | 0.412473 | 0.00172600 | 18.9107 | 02820046 | 0.00000 | 0.414199 | 18.8612 |
| 2 | 02820048 | 0.414190 | 9.00030e-06 | 18.7654 | 02820049 | 0.00115448 | 0.413045 | 18.7903 |
| 3 | 02820051 | 0.412512 | 0.00168699 | 18.3133 | 02820050 | -0.000578411 | 0.414777 | 18.6483 |