| Red | Green | Blue | |
| z | 17.64 | ||
| znorm | Inf | ||
| sky | -NaN | -NaN | -Inf |
| S/N | 36.3 | 53.3 | 58.2 |
| S/N(c) | 0.0 | 0.0 | 0.0 |
| SN(E/C) |
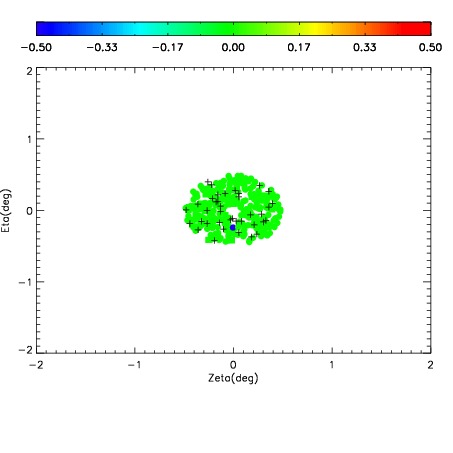
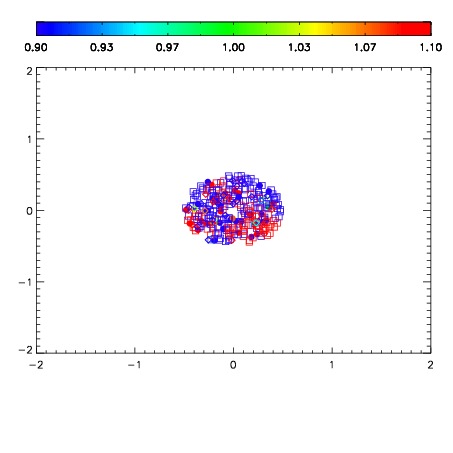
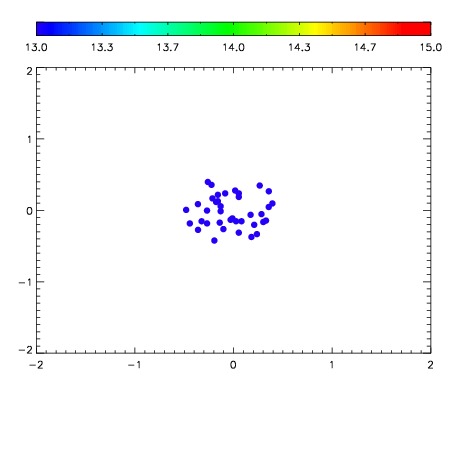

| Frame | Nreads | Zeropoints | Mag plots | Spatial mag deviation | Spatial sky 16325A emission deviations (filled: sky, open: star) | Spatial sky continuum emission | Spatial sky telluric CO2 absorption deviations (filled: H < 10) | |||||||||||||||||||||||
| 0 | 0 |
|
|
|
|
|
|
| 01910024 | 0.00000 | 18.3906 |
| 01910025 | 0.00000 | 18.3744 |
| 01910026 | 0.00000 | 18.1930 |
| 01910027 | 0.00000 | 18.5657 |
| 01910028 | 0.00000 | 18.2900 |
| 01910029 | 0.00000 | 18.4599 |
| 01910030 | 0.00000 | 17.4282 |
| 01910031 | 0.00000 | 16.7661 |
| 01910032 | 0.00000 | 18.1419 |
| 01910033 | 0.00000 | 18.4807 |
| 01910034 | 0.00000 | 18.6516 |
| 01910035 | 0.00000 | 18.5631 |