| Red | Green | Blue | |
| z | 17.64 | ||
| znorm | Inf | ||
| sky | -Inf | -Inf | -Inf |
| S/N | 28.8 | 43.5 | 46.2 |
| S/N(c) | 0.0 | 0.0 | 0.0 |
| SN(E/C) |
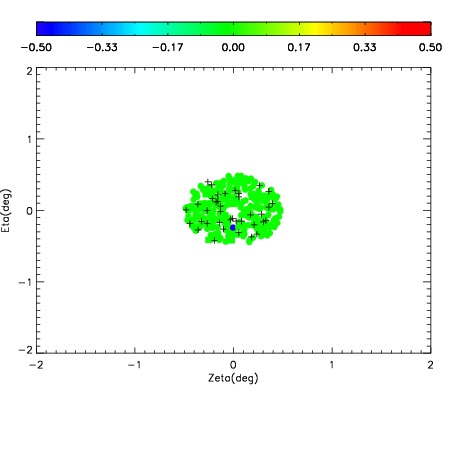
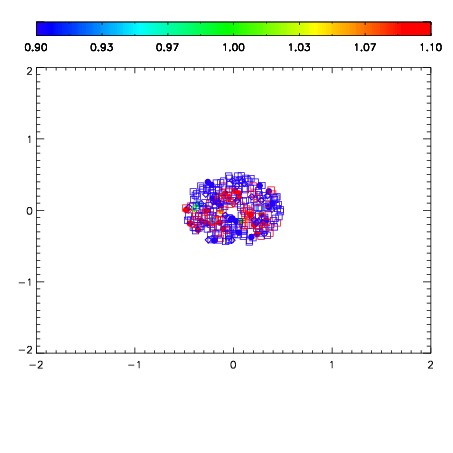
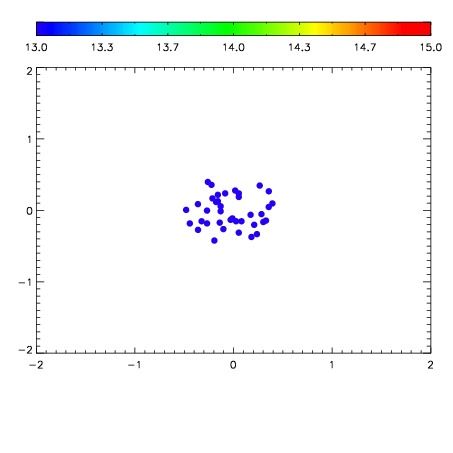

| Frame | Nreads | Zeropoints | Mag plots | Spatial mag deviation | Spatial sky 16325A emission deviations (filled: sky, open: star) | Spatial sky continuum emission | Spatial sky telluric CO2 absorption deviations (filled: H < 10) | |||||||||||||||||||||||
| 0 | 0 |
|
|
|
|
|
|
| IPAIR | NAME | SHIFT | NEWSHIFT | S/N | NAME | SHIFT | NEWSHIFT | S/N |
| 0 | 04870072 | 0.496419 | 0.00000 | 18.7288 | 04870073 | 0.000384762 | 0.496034 | 18.7408 |
| 1 | 04870071 | 0.494402 | 0.00201702 | 18.8969 | 04870070 | 0.00000 | 0.496419 | 18.8934 |
| 2 | 04870076 | 0.496337 | 8.20160e-05 | 18.7527 | 04870074 | -0.00175869 | 0.498178 | 18.8030 |
| 3 | 04870075 | 0.495955 | 0.000464022 | 18.6407 | 04870077 | 0.000596417 | 0.495823 | 18.6902 |