| Red | Green | Blue | |
| z | 17.64 | ||
| znorm | Inf | ||
| sky | -Inf | -Inf | -Inf |
| S/N | 24.5 | 41.6 | 43.5 |
| S/N(c) | 0.0 | 0.0 | 0.0 |
| SN(E/C) |
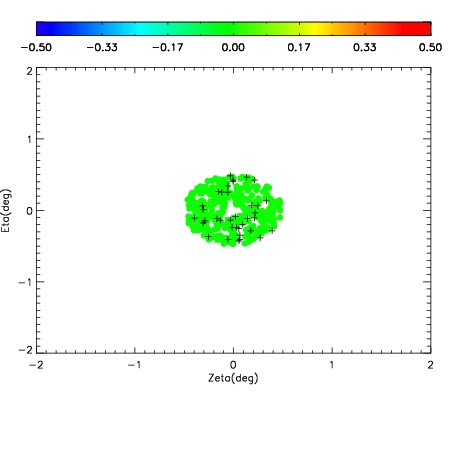
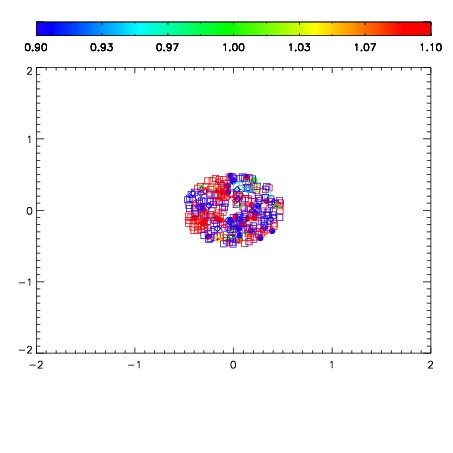


| Frame | Nreads | Zeropoints | Mag plots | Spatial mag deviation | Spatial sky 16325A emission deviations (filled: sky, open: star) | Spatial sky continuum emission | Spatial sky telluric CO2 absorption deviations (filled: H < 10) | |||||||||||||||||||||||
| 0 | 0 |
|
|
|
|
|
|
| IPAIR | NAME | SHIFT | NEWSHIFT | S/N | NAME | SHIFT | NEWSHIFT | S/N |
| 0 | 12770023 | 0.486790 | 0.00000 | 18.9861 | 12770017 | 0.00000 | 0.486790 | 18.9521 |
| 1 | 12770018 | 0.485482 | 0.00130799 | 19.0152 | 12770024 | 0.000669124 | 0.486121 | 18.9614 |
| 2 | 12770022 | 0.486753 | 3.70145e-05 | 18.9594 | 12770021 | 0.00163018 | 0.485160 | 18.9197 |
| 3 | 12770019 | 0.485484 | 0.00130600 | 18.9541 | 12770020 | 0.00138348 | 0.485407 | 18.7525 |