| Red | Green | Blue | |
| z | 17.63 | ||
| znorm | Inf | ||
| sky | -NaN | -NaN | -Inf |
| S/N | 30.8 | 46.7 | 50.4 |
| S/N(c) | 0.0 | 0.0 | 0.0 |
| SN(E/C) |
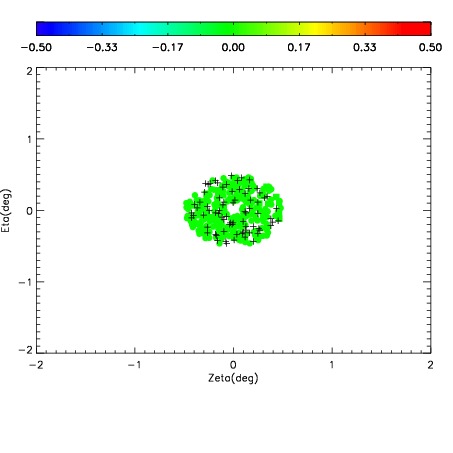
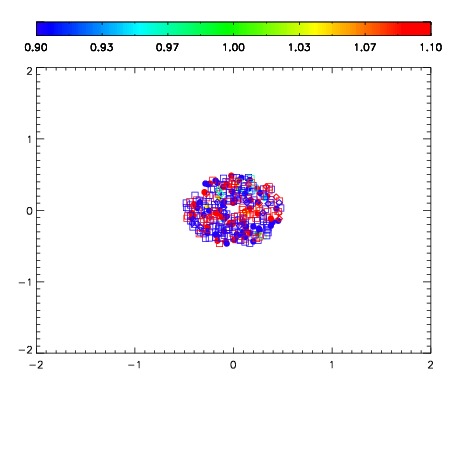


| Frame | Nreads | Zeropoints | Mag plots | Spatial mag deviation | Spatial sky 16325A emission deviations (filled: sky, open: star) | Spatial sky continuum emission | Spatial sky telluric CO2 absorption deviations (filled: H < 10) | |||||||||||||||||||||||
| 0 | 0 |
|
|
|
|
|
|
| 01980020 | 0.00000 | 18.6221 |
| 01980021 | 0.00000 | 18.3748 |
| 01980022 | 0.00000 | 18.5579 |
| 01980023 | 0.00000 | 18.4770 |
| 01980024 | 0.00000 | 18.5574 |
| 01980025 | 0.00000 | 18.6153 |
| 01980026 | 0.00000 | 18.6389 |