| Red | Green | Blue | |
| z | 17.64 | ||
| znorm | Inf | ||
| sky | -NaN | -NaN | -Inf |
| S/N | 23.4 | 41.6 | 45.7 |
| S/N(c) | 0.0 | 0.0 | 0.0 |
| SN(E/C) |
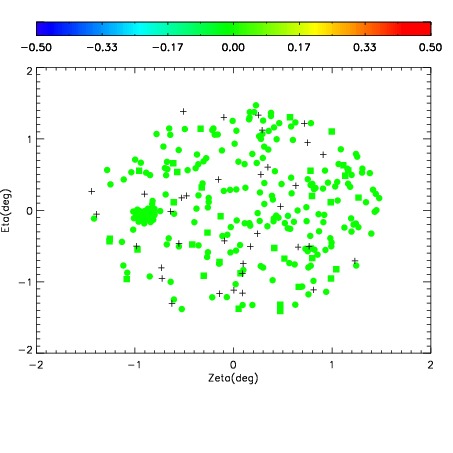
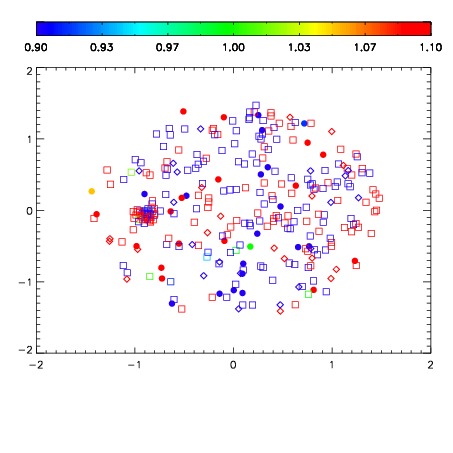
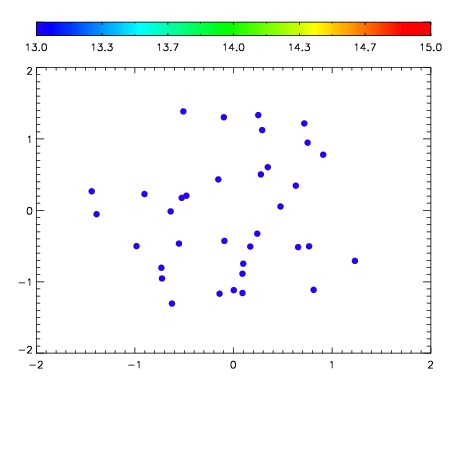

| Frame | Nreads | Zeropoints | Mag plots | Spatial mag deviation | Spatial sky 16325A emission deviations (filled: sky, open: star) | Spatial sky continuum emission | Spatial sky telluric CO2 absorption deviations (filled: H < 10) | |||||||||||||||||||||||
| 0 | 0 |
|
|
|
|
|
|
| IPAIR | NAME | SHIFT | NEWSHIFT | S/N | NAME | SHIFT | NEWSHIFT | S/N |
| 0 | 02490018 | 0.416958 | 0.00000 | 18.9355 | 02490020 | 0.00227397 | 0.414684 | 19.0304 |
| 1 | 02490017 | 0.415125 | 0.00183299 | 18.9151 | 02490016 | 0.00000 | 0.416958 | 18.9795 |
| 2 | 02490022 | 0.416392 | 0.000566006 | 18.8343 | 02490019 | 0.00303282 | 0.413925 | 18.9590 |
| 3 | 02490021 | 0.414918 | 0.00204000 | 18.8223 | 02490023 | 0.00297766 | 0.413980 | 18.9495 |