| Red | Green | Blue | |
| z | 17.64 | ||
| znorm | Inf | ||
| sky | -Inf | -Inf | -Inf |
| S/N | 26.0 | 43.7 | 48.3 |
| S/N(c) | 0.0 | 0.0 | 0.0 |
| SN(E/C) |
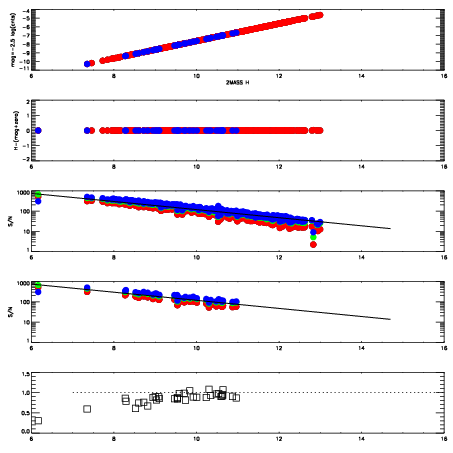

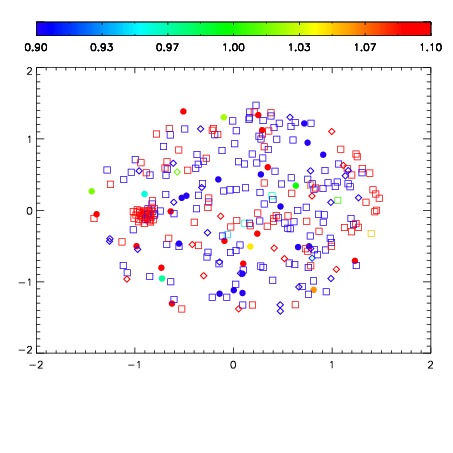
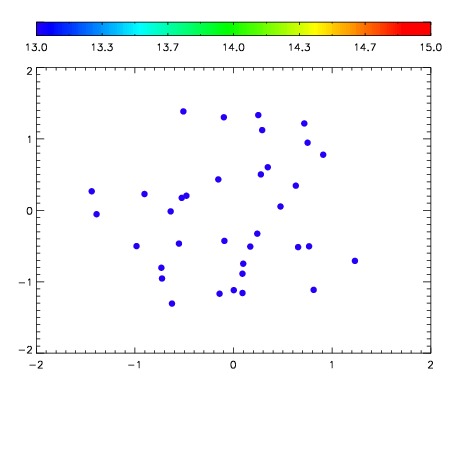

| Frame | Nreads | Zeropoints | Mag plots | Spatial mag deviation | Spatial sky 16325A emission deviations (filled: sky, open: star) | Spatial sky continuum emission | Spatial sky telluric CO2 absorption deviations (filled: H < 10) | |||||||||||||||||||||||
| 0 | 0 |
|
|
|
|
|
|
| IPAIR | NAME | SHIFT | NEWSHIFT | S/N | NAME | SHIFT | NEWSHIFT | S/N |
| 0 | 02780020 | 0.417742 | 0.00000 | 18.8842 | 02780021 | 0.00816349 | 0.409579 | 18.8985 |
| 1 | 02780015 | 0.413505 | 0.00423703 | 19.0789 | 02780018 | 0.00173207 | 0.416010 | 19.0954 |
| 2 | 02780016 | 0.416932 | 0.000810027 | 19.0017 | 02780017 | 0.00787606 | 0.409866 | 19.0951 |
| 3 | 02780019 | 0.415686 | 0.00205600 | 18.9844 | 02780014 | 0.00000 | 0.417742 | 19.0274 |