| Red | Green | Blue | |
| z | 17.64 | ||
| znorm | Inf | ||
| sky | -Inf | -Inf | -Inf |
| S/N | 31.9 | 54.2 | 58.1 |
| S/N(c) | 0.0 | 0.0 | 0.0 |
| SN(E/C) |
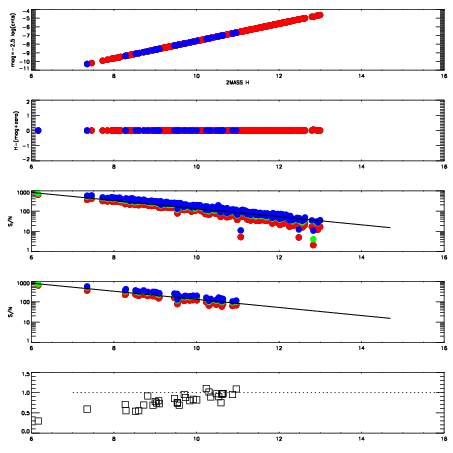
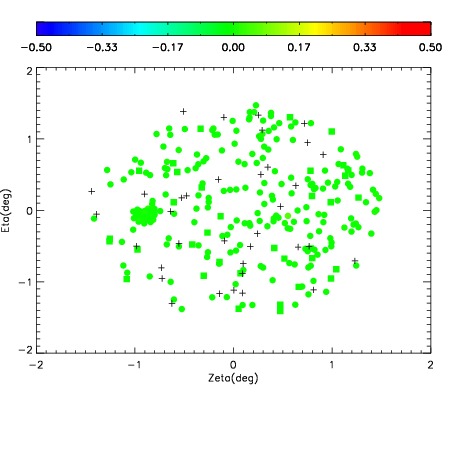
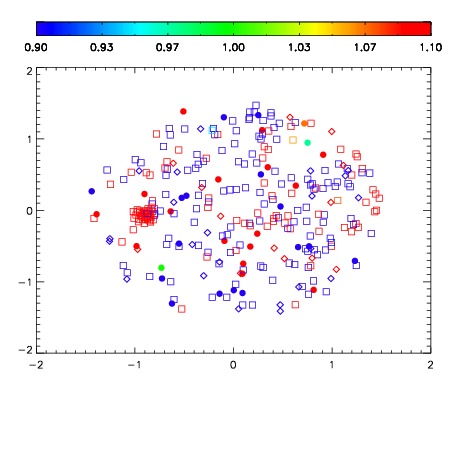
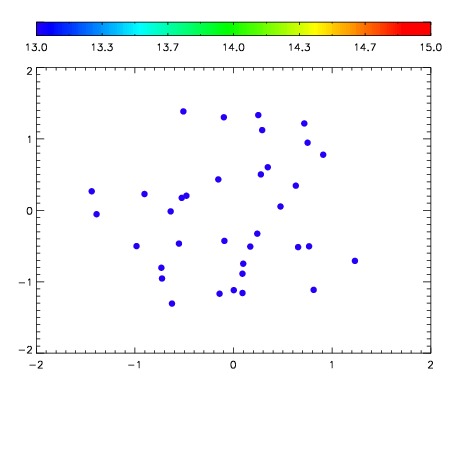

| Frame | Nreads | Zeropoints | Mag plots | Spatial mag deviation | Spatial sky 16325A emission deviations (filled: sky, open: star) | Spatial sky continuum emission | Spatial sky telluric CO2 absorption deviations (filled: H < 10) | |||||||||||||||||||||||
| 0 | 0 |
|
|
|
|
|
|
| IPAIR | NAME | SHIFT | NEWSHIFT | S/N | NAME | SHIFT | NEWSHIFT | S/N |
| 0 | 02890012 | 0.407613 | 0.00000 | 19.1474 | 02890013 | 0.000734072 | 0.406879 | 19.1561 |
| 1 | 02890015 | 0.399894 | 0.00771901 | 19.1793 | 02890017 | 0.00287342 | 0.404740 | 19.1819 |
| 2 | 02890016 | 0.400037 | 0.00757602 | 19.1765 | 02890014 | 0.00148576 | 0.406127 | 19.1707 |
| 3 | 02890019 | 0.398522 | 0.00909102 | 19.1243 | 02890018 | 0.000893861 | 0.406719 | 19.1209 |
| 4 | 02890011 | 0.406877 | 0.000735998 | 19.1180 | 02890010 | 0.00000 | 0.407613 | 19.0930 |