| Red | Green | Blue | |
| z | 17.64 | ||
| znorm | Inf | ||
| sky | -Inf | -Inf | -Inf |
| S/N | 20.6 | 37.1 | 39.3 |
| S/N(c) | 0.0 | 0.0 | 0.0 |
| SN(E/C) |
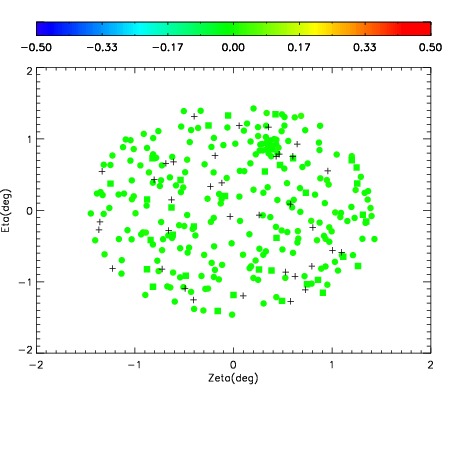
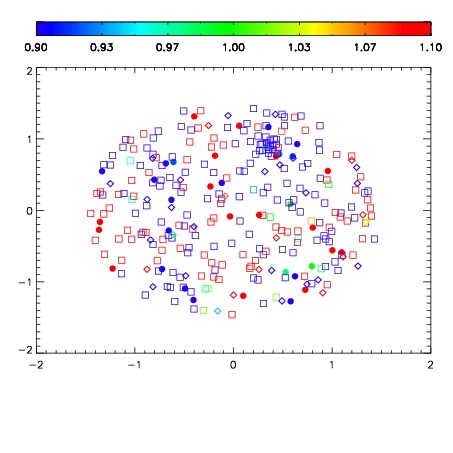
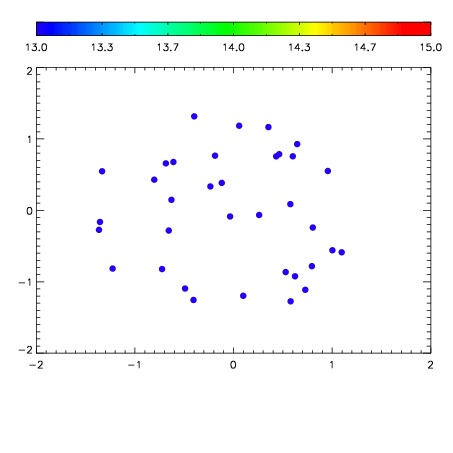

| Frame | Nreads | Zeropoints | Mag plots | Spatial mag deviation | Spatial sky 16325A emission deviations (filled: sky, open: star) | Spatial sky continuum emission | Spatial sky telluric CO2 absorption deviations (filled: H < 10) | |||||||||||||||||||||||
| 0 | 0 |
|
|
|
|
|
|
| IPAIR | NAME | SHIFT | NEWSHIFT | S/N | NAME | SHIFT | NEWSHIFT | S/N |
| 0 | 02510021 | 0.413208 | 0.00000 | 17.7939 | 02510018 | 0.000700177 | 0.412508 | 18.5985 |
| 1 | 02510012 | 0.403939 | 0.00926900 | 18.9780 | 02510014 | 0.00102396 | 0.412184 | 18.9127 |
| 2 | 02510013 | 0.406480 | 0.00672799 | 18.8707 | 02510011 | 0.00000 | 0.413208 | 18.8605 |
| 3 | 02510020 | 0.409331 | 0.00387701 | 18.2628 | 02510015 | -0.000495967 | 0.413704 | 18.8576 |
| 4 | 02510017 | 0.411106 | 0.00210202 | 17.2210 | 02510019 | -0.00191195 | 0.415120 | 15.8227 |
| 5 | 02510016 | 0.409818 | 0.00339001 | 15.3280 | 02510022 | 0.00108731 | 0.412121 | 15.8208 |