| Red | Green | Blue | |
| z | 17.64 | ||
| znorm | Inf | ||
| sky | -Inf | -Inf | -Inf |
| S/N | 27.6 | 47.5 | 51.0 |
| S/N(c) | 0.0 | 0.0 | 0.0 |
| SN(E/C) |
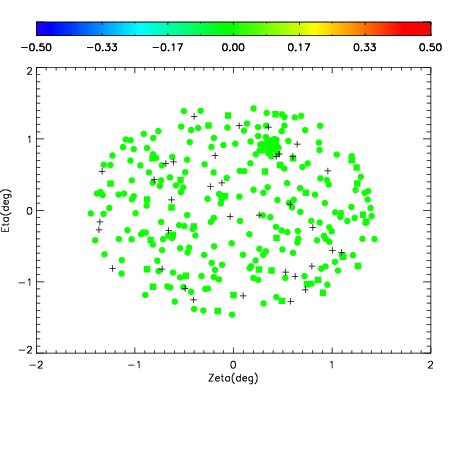
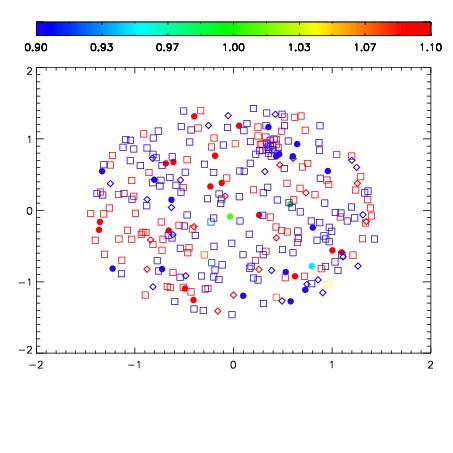
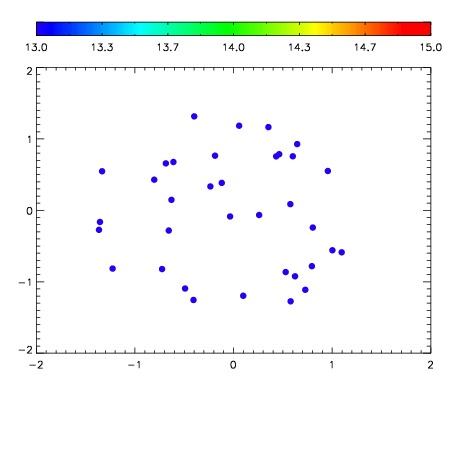

| Frame | Nreads | Zeropoints | Mag plots | Spatial mag deviation | Spatial sky 16325A emission deviations (filled: sky, open: star) | Spatial sky continuum emission | Spatial sky telluric CO2 absorption deviations (filled: H < 10) | |||||||||||||||||||||||
| 0 | 0 |
|
|
|
|
|
|
| IPAIR | NAME | SHIFT | NEWSHIFT | S/N | NAME | SHIFT | NEWSHIFT | S/N |
| 0 | 02870018 | 0.409121 | 0.00000 | 19.1454 | 02870015 | 0.00279059 | 0.406330 | 19.1575 |
| 1 | 02870013 | 0.406809 | 0.00231200 | 19.1602 | 02870016 | 0.00146772 | 0.407653 | 19.1798 |
| 2 | 02870014 | 0.408856 | 0.000265002 | 19.1409 | 02870012 | 0.00000 | 0.409121 | 19.1446 |
| 3 | 02870017 | 0.408113 | 0.00100800 | 19.1332 | 02870019 | 0.00499522 | 0.404126 | 19.1183 |