| Red | Green | Blue | |
| z | 17.64 | ||
| znorm | Inf | ||
| sky | -Inf | -Inf | -Inf |
| S/N | 29.5 | 50.2 | 53.2 |
| S/N(c) | 0.0 | 0.0 | 0.0 |
| SN(E/C) |
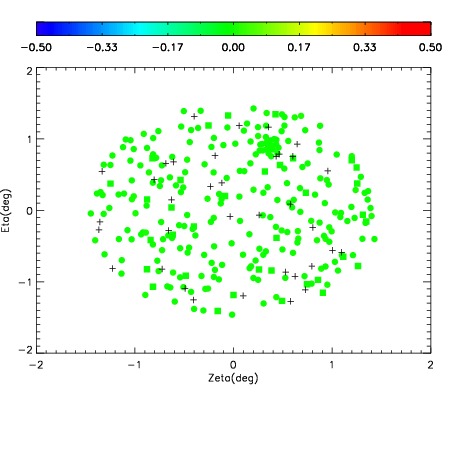


| Frame | Nreads | Zeropoints | Mag plots | Spatial mag deviation | Spatial sky 16325A emission deviations (filled: sky, open: star) | Spatial sky continuum emission | Spatial sky telluric CO2 absorption deviations (filled: H < 10) | |||||||||||||||||||||||
| 0 | 0 |
|
|
|
|
|
|
| IPAIR | NAME | SHIFT | NEWSHIFT | S/N | NAME | SHIFT | NEWSHIFT | S/N |
| 0 | 03040010 | 0.497716 | 0.00000 | 19.1717 | 03040011 | 0.00154821 | 0.496168 | 19.2132 |
| 1 | 03040013 | 0.490942 | 0.00677401 | 19.1998 | 03040012 | -7.05056e-05 | 0.497787 | 19.2156 |
| 2 | 03040009 | 0.495889 | 0.00182700 | 19.1612 | 03040015 | -0.00337284 | 0.501089 | 19.1294 |
| 3 | 03040014 | 0.492100 | 0.00561601 | 19.1412 | 03040008 | 0.00000 | 0.497716 | 19.1152 |