| Red | Green | Blue | |
| z | 17.64 | ||
| znorm | Inf | ||
| sky | -Inf | -Inf | -Inf |
| S/N | 22.3 | 40.3 | 41.8 |
| S/N(c) | 0.0 | 0.0 | 0.0 |
| SN(E/C) |
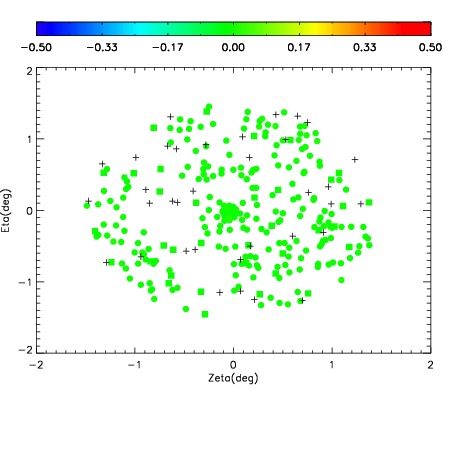
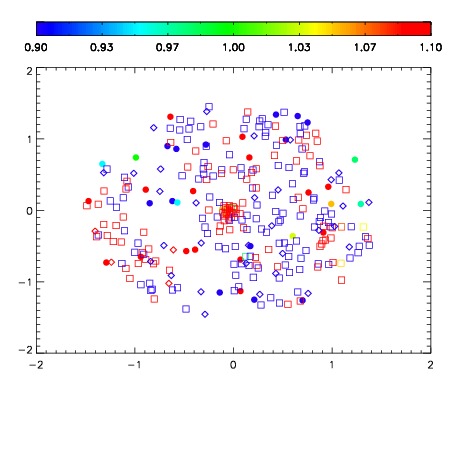
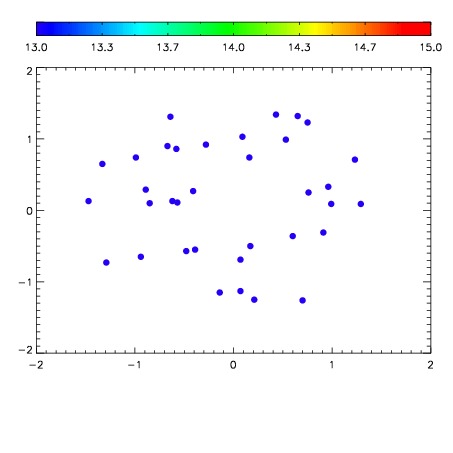

| Frame | Nreads | Zeropoints | Mag plots | Spatial mag deviation | Spatial sky 16325A emission deviations (filled: sky, open: star) | Spatial sky continuum emission | Spatial sky telluric CO2 absorption deviations (filled: H < 10) | |||||||||||||||||||||||
| 0 | 0 |
|
|
|
|
|
|
| IPAIR | NAME | SHIFT | NEWSHIFT | S/N | NAME | SHIFT | NEWSHIFT | S/N |
| 0 | 02600028 | 0.418254 | 0.00000 | 18.9751 | 02600033 | 0.00328096 | 0.414973 | 18.9915 |
| 1 | 02600027 | 0.416054 | 0.00219998 | 19.0347 | 02600026 | 0.00000 | 0.418254 | 19.0789 |
| 2 | 02600032 | 0.418195 | 5.89788e-05 | 18.8888 | 02600029 | 0.00390633 | 0.414348 | 18.8943 |
| 3 | 02600031 | 0.416762 | 0.00149199 | 18.7878 | 02600030 | -0.000484693 | 0.418739 | 18.7809 |